As a researcher, your goal is to estimate the effect of a drug on test scores...
As a researcher, your goal is to estimate the effect of a drug on test scores of human subjects undertaking a test in Statistics. All subjects were divided into two populations X and Y , with members of population X receiving the drug prior to testing and members of population Y receiving a placebo prior to testing. 16 subjects were chosen randomly from population X and the mean score in this group was equal to 9.78, with the sample standard deviation being 3.24. Another group of 9 subjects, chosen randomly from population Y , was used as a control group and had a mean score of 15.1, with the sample standard deviation of 4.17. Assume that test scores in both populations are distributed as normal with X ∼ N (µX, σ2 X) and Y ∼ N (µY , σ2 Y ), where µX, µY are unknown population means and σ 2 X, σ 2 Y are unknown population variances. Note: you will need to use computer software (Excel, Stata) or scientific calculators to obtain exact answers to some of the questions below. 1. Suppose your colleague has provided you with the values for the true population variances: σ 2 X = 9 and σ 2 Y = 16. Using this information, calculate 3
(a) 95% confidence interval for µX
(b) 95% confidence interval for µY
(c) p-value of a hypothesis test of H0 : µX = 8.5 vs Ha : µX > 8.5
(d) p-value of a hypothesis test of H0 : µY = 17.5 vs Ha : µY 6= 17.5
Homework Answers
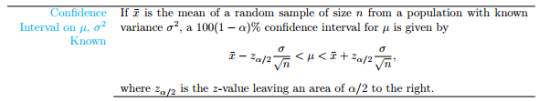
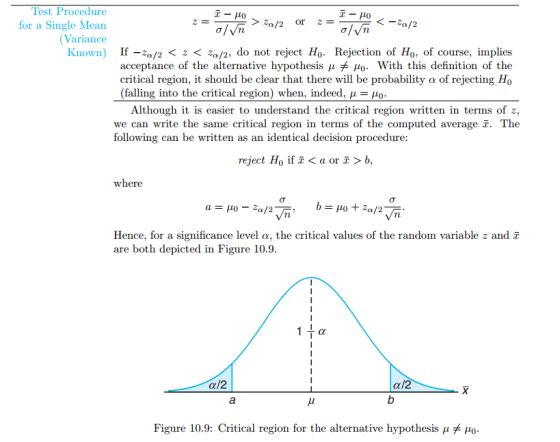
when we know population variance
we can use 1-sample z-test to calculate confidence interval
a)
n = 16 , sample mean= 9.78 , sd = 3
95% confidence interval
(8.310, 11.250)
b)
The assumed standard deviation = 4
N Mean SE Mean 95%
CI
9 15.10 1.33 (12.49,
17.71)
c)
TS = 1.71
p-value = 0.044
d)
TS = -1.80
p-value = 0.036
Add Answer to:
As a researcher, your goal is to estimate the effect of a drug on test scores...
A researcher intends to estimate the effect of a drug on the scores of human subjects...
 A researcher intends to estimate the effect of a drug on the scores of human subjects performing a task of psychomotor coordination. The members of a random sample of 9 subjects were given the drug prior to testing. The mean score in this group was 9.91, and the sample variance was 17.72. An independent random sample of 10 subjects was used as a control group and given a placebo prior to testing. The mean score in this control group was...
Let X1, X2, . . . , Xn be a random sample of size n from...
Let X1, X2, . . . , Xn be a random sample of size n from a normal population with mean µX and variance σ ^2 . Let Y1, Y2, . . . , Ym be a random sample of size m from a normal population with mean µY and variance σ ^2 . Also, assume that these two random samples are independent. It is desired to test the following hypotheses H0 : σX = σY versus H1 : σX...
Suppose for the two exams in this course, we would like to see if there is any significant improvement from exam 1 to exam 2, i.e., testing H0 : µx ≥ µy vs HA : µx < µy for the average exam scores....
Suppose for the two exams in this course, we would like to see if there is any significant improvement from exam 1 to exam 2, i.e., testing H0 : µx ≥ µy vs HA : µx < µy for the average exam scores. Suppose we have n = 36 students, and the sample statistics are x¯ = 21, y¯ = 22, sx = sy = 3 and sxy = 4.5. Compute the p-value using paired two-sample test Suppose we use...
The U.S. Department of Agriculture (USDA) uses sample surveys to produce important economic estimates. One pilot...
The U.S. Department of Agriculture (USDA) uses sample surveys to produce important economic estimates. One pilot study estimated wheat prices in July and in September using independent samples of wheat producers in the two months. Here are the summary statistics, in dollars per bushel: Month Sample size Sample mean Sample SD September 61 $3.21 $0.40 July 80 $3.11 $0.20 The September prices are higher on the average. But we have data from only a sample of producers each month. Can...
A group of n - 9 students was selected for a comparative study that involved their Exam 1 scores ...
 A group of n - 9 students was selected for a comparative study that involved their Exam 1 scores [variable - X] and their overall course grades [variable Y] Educators intend to draw inferences about the differences D = Y-X) assuming that differences are normally distributed with unknown parameters. The sample summaries are presented below. Summaries Values Average X X-bar]-74.98 | AverageYSample SD [D] [Y-barl-69.70 S = 9.0 Hypothesis Testing At the significance level, α-500, do you have enough evidence...
Multiple choice questions 1. Which of the following correctly describes the difference between paired and independent...
 Multiple choice questions 1. Which of the following correctly describes the difference between paired and independent sample data? A) Independent samples operate based on a known o, whereas paired samples may operate with a sample standard deviation. B) Independent samples are used to address the difference between two separate populations, whereas paired samples involve a matched analysis. C) Independent samples incorporate at distribution, whereas paired samples may use the z distribution for approximation. D) Independent samples always have the same...
Test No. 3 ( (Form B)Math 100 Spring 2019 I. Multiple-choice (Circle the letter of your...
 Test No. 3 ( (Form B)Math 100 Spring 2019 I. Multiple-choice (Circle the letter of your answer): Questions No. 1 through No. 5 refer to the following: A continuous s has a normal distribution with the mean of 80 and standard deviation of 15 random variable x (1) The mode of the variable s is A 80 (B) 15 (C) 40 (D) Unknown (2) The z-score for the mode of x : (A) I (3) The p (B) 0.S ity...
Question 1 A study was conducted to estimate μ, the mean number of weekly hours that...
Question 1 A study was conducted to estimate μ, the mean number of weekly hours that U.S. adults use computers at home. Suppose a random sample of 81 U.S. adults gives a mean weekly computer usage time of 8.5 hours and that from prior studies, the population standard deviation is assumed to be σ = 3.6 hours. A similar study conducted a year earlier estimated that μ, the mean number of weekly hours that U.S. adults use computers at home,...
1. We reject the null hypothesis only when: a. our sample mean is larger than the population mean. b. the p value asso...
1. We reject the null hypothesis only when: a. our sample mean is larger than the population mean. b. the p value associated with our test statistic is greater than the significance level of the test we have chosen. c. our sample mean is smaller than the population mean. d. the p value associated with our test statistic is smaller than the significance level of the test we have chosen. 2. In a study of simulated juror decision making, researchers...
TEST 1: ANSWERS INTS EACH). This section takes around 5 minutes. Name Spring 2019 8) A researcher wants to determine whether female teachers give higher or lower grades, on average, then male t...
 TEST 1: ANSWERS INTS EACH). This section takes around 5 minutes. Name Spring 2019 8) A researcher wants to determine whether female teachers give higher or lower grades, on average, then male teachers. She picks a random sample by picking a random sample of schools, in the schools picked, picking a random sample of departments, and in the departments picked, picking a random sample of teachers. What kind of sampling was performed? d) voluntary response e) cluster b) stratified Random...
 A researcher intends to estimate the effect of a drug on the scores of human subjects performing a task of psychomotor coordination. The members of a random sample of 9 subjects were given the drug prior to testing. The mean score in this group was 9.91, and the sample variance was 17.72. An independent random sample of 10 subjects was used as a control group and given a placebo prior to testing. The mean score in this control group was...
 A group of n - 9 students was selected for a comparative study that involved their Exam 1 scores [variable - X] and their overall course grades [variable Y] Educators intend to draw inferences about the differences D = Y-X) assuming that differences are normally distributed with unknown parameters. The sample summaries are presented below. Summaries Values Average X X-bar]-74.98 | AverageYSample SD [D] [Y-barl-69.70 S = 9.0 Hypothesis Testing At the significance level, α-500, do you have enough evidence...
 Multiple choice questions 1. Which of the following correctly describes the difference between paired and independent sample data? A) Independent samples operate based on a known o, whereas paired samples may operate with a sample standard deviation. B) Independent samples are used to address the difference between two separate populations, whereas paired samples involve a matched analysis. C) Independent samples incorporate at distribution, whereas paired samples may use the z distribution for approximation. D) Independent samples always have the same...
 Test No. 3 ( (Form B)Math 100 Spring 2019 I. Multiple-choice (Circle the letter of your answer): Questions No. 1 through No. 5 refer to the following: A continuous s has a normal distribution with the mean of 80 and standard deviation of 15 random variable x (1) The mode of the variable s is A 80 (B) 15 (C) 40 (D) Unknown (2) The z-score for the mode of x : (A) I (3) The p (B) 0.S ity...
 TEST 1: ANSWERS INTS EACH). This section takes around 5 minutes. Name Spring 2019 8) A researcher wants to determine whether female teachers give higher or lower grades, on average, then male teachers. She picks a random sample by picking a random sample of schools, in the schools picked, picking a random sample of departments, and in the departments picked, picking a random sample of teachers. What kind of sampling was performed? d) voluntary response e) cluster b) stratified Random...
Most questions answered within 3 hours.
-
At a local university, you poll a group of 115 students and find
that 37 of...
asked 4 minutes ago -
Gladstone company tracks the number of units purchased and sold
throughout each accounting period but applies...
asked 7 minutes ago -
When determining if a molecule's configuration is E or Z, what
determines the higher priority groups?
asked 11 minutes ago -
13. What is the amount
of conversion cost transferred to finished goods? (Round
your intermediate calculations...
asked 13 minutes ago -
Sulfuric Acid is a "strong" acid, but only releases a single
proton when it dissolves. What...
asked 13 minutes ago -
The
second floor of a house is 6 m above the street level. How much
work...
asked 15 minutes ago -
What uncontrollable factor(s) contributed to Hong Kong Disney’s
poor performance during its first year?
asked 17 minutes ago -
I wish to estimate µ, the mean of a population. After I collect
and an-
alyze...
asked 23 minutes ago -
You are interested in whether students that have a male
instructors perform differently on exams. To...
asked 29 minutes ago -
Discuss the following: The policies that promote economic
growth. Why are some countries more developed than...
asked 25 minutes ago -
I am supposed to reduce redundancy in the code and also make
unknown inputs, output "unknown"....
asked 31 minutes ago -
The ages of a group of
147
randomly selected adult females have a standard deviation of...
asked 35 minutes ago