Please label and show each step 2. Consider the following hypothesis test: Ho: μ ≤ 50...
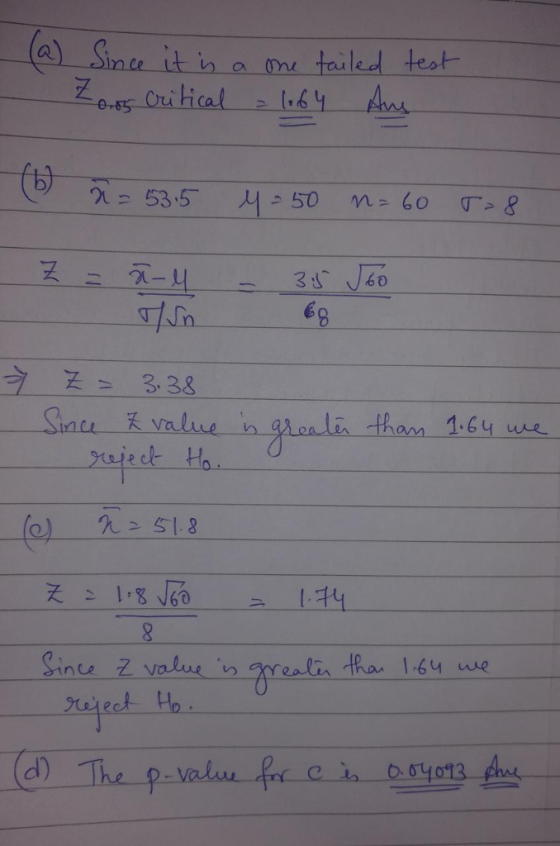
Please label and show each step 2. Consider the following hypothesis test: Ho: μ ≤ 50 H1: μ > 50 A sample of 60 is used and the population standard deviation is 8. Use α=0.05.
a. Z critical = _______________
b. Sample mean = 53.5, z calc = ______________. Do you reject Ho?
c. Sample mean = 51.8, z calc = ______________. Do you reject Ho?
d. The Pvalue for c is:_________________
Homework Answers
kindly up vote my answer.
Add Answer to:
Please label and show each step 2. Consider the following hypothesis test: Ho: μ ≤ 50...
Name and Signature: 1. Consider the following hypothesis test A sample of 50 provided a sample...
 Name and Signature: 1. Consider the following hypothesis test A sample of 50 provided a sample mean of 15.15. The population standard deviation is 3. a. Compute the value of the test statistic. b. What is the p value? C. At α : 0.05, what is the rejection rule using the critical value? what is your conclusion? 2. Consider the following hypothesis test: A sample of 60 is used and the population standard deviation is 8. Use a 0.05. a....
Please clearly show and label each step Consider the following hypothesis test: Ho: μ = 16...
Please clearly show and label each step Consider the following hypothesis test: Ho: μ = 16 H1: μ ≠ 16 A sample of 50 provided a sample mean of 15.15. The population standard deviation is 3. Compute the value of the test statistic. What is the p value? At α = 0.05, what is the rejection rule using the critical value? What is your conclusion?
Consider the following hypothesis test: Ho: μ 50 Ha: μ > 50 A sample of 50...
 Consider the following hypothesis test: Ho: μ 50 Ha: μ > 50 A sample of 50 is used and the population standard deviation is 6. Use the critical value approach to state your conclusion for each of the following sample results. Use 05. a. With = 52.5, what is the value of the test statistic (to 2 decimals)? Can it be concluded that the population mean is greater than 50? | Select ▼ b. With C-51, what is the value...
Consider the following hypothesis test. H0: μ ≤ 50 Ha: μ > 50 A sample of...
Consider the following hypothesis test. H0: μ ≤ 50 Ha: μ > 50 A sample of 60 is used and the population standard deviation is 8. Use the critical value approach to state your conclusion for each of the following sample results. Use α = 0.05. (Round your answers to two decimal places.) (a)x = 52.5 Find the value of the test statistic. State the critical values for the rejection rule. (If the test is one-tailed, enter NONE for the...
Consider the following hypothesis test: H_0: µ <= 50 H_a: µ > 50 A sample of...
Consider the following hypothesis test: H_0: µ <= 50 H_a: µ > 50 A sample of size 60 provided a sample mean of 51.8. The population standard deviation is 8. a) Compute the value of the test statistic, rounding all calculations to 2 decimal places. b) What is the associated p-value? c) Using α = 0.05, what is your conclusion? Enter either "reject" or "fail to reject" without the quotes for what to do with the null hypothesis.
Consider the following hypothesis test: Ho: 50 Hai 4 > 50 A sample of 65 is...
 Consider the following hypothesis test: Ho: 50 Hai 4 > 50 A sample of 65 is used and the population standard deviation is 8. Use the critical value approach to state your conclusion for each of the following sample results. Use a = .05. a. With 2 = 52.5, what is the value of the test statistic (to 2 decimals)? Can it be concluded that the population mean is greater than 50? Yes b. With 2 - 51, what is...
Consider the following hypothesis test: Ho: u = 15 Hai ji #15 A sample of 50...
 Consider the following hypothesis test: Ho: u = 15 Hai ji #15 A sample of 50 provided a sample mean of 14.15. The population standard deviation is 4. Enter negative value as negative number. a. Compute the value of the test statistic (to 2 decimals). -.03 b. What is the p-value (to 4 decimals)? Use the value of the test statistic rounded to 2 decimal places in your calculations. c. Using a = 0.05, can it be concluded that the...
eBook Exercise 9.13 (Algorithmic) Consider the following hypothesis test: но: 50 Ha: μ > 50 A...
 eBook Exercise 9.13 (Algorithmic) Consider the following hypothesis test: но: 50 Ha: μ > 50 A sample of 55 is used and the population standard deviation is 7. Use the critical value approach to state your conclusion for each of the following sample results. Use a-.05 a. With x = 52.5, what is the value of the test statistic (to 2 decimals)? Can it be concluded that the population mean is greater than 50? Select your answer b. With x-51,...
Consider the following hypotheses: Ho: μ s 57.1 HA: μ > 57.1 A sample of 22...
 Consider the following hypotheses: Ho: μ s 57.1 HA: μ > 57.1 A sample of 22 observations yields a sample mean of 58.2. Assume that the sample is drawn from a normal population with a population standard deviation of 3.6. (You may find it useful to reference the appropriate table: z table or t table) a-1. Find the p-value. pvalue 20.10 Op-value0.01 0.01 s p-value<0.025 0.025 s p-value 0.05 0.05 s p-value<0.10 a-2. what is the conclusion if α-010? O...
A test is made of Ho: μ-20 versus H 1 : μ * 20. A sample...
 A test is made of Ho: μ-20 versus H 1 : μ * 20. A sample of size n-58 is drawn, and x-1 The population standard deviation isa . Part 4 out of 4 Sub Determine whether to reject Ho. Since the test statistic (select) in the critical region, we (select) α-0.05 level. Tim - Ho at the Since the test statistic (select) in the critical region, we (select) α 0.01 level. -Ho at the
 Name and Signature: 1. Consider the following hypothesis test A sample of 50 provided a sample mean of 15.15. The population standard deviation is 3. a. Compute the value of the test statistic. b. What is the p value? C. At α : 0.05, what is the rejection rule using the critical value? what is your conclusion? 2. Consider the following hypothesis test: A sample of 60 is used and the population standard deviation is 8. Use a 0.05. a....
 Consider the following hypothesis test: Ho: μ 50 Ha: μ > 50 A sample of 50 is used and the population standard deviation is 6. Use the critical value approach to state your conclusion for each of the following sample results. Use 05. a. With = 52.5, what is the value of the test statistic (to 2 decimals)? Can it be concluded that the population mean is greater than 50? | Select ▼ b. With C-51, what is the value...
 Consider the following hypothesis test: Ho: 50 Hai 4 > 50 A sample of 65 is used and the population standard deviation is 8. Use the critical value approach to state your conclusion for each of the following sample results. Use a = .05. a. With 2 = 52.5, what is the value of the test statistic (to 2 decimals)? Can it be concluded that the population mean is greater than 50? Yes b. With 2 - 51, what is...
 Consider the following hypothesis test: Ho: u = 15 Hai ji #15 A sample of 50 provided a sample mean of 14.15. The population standard deviation is 4. Enter negative value as negative number. a. Compute the value of the test statistic (to 2 decimals). -.03 b. What is the p-value (to 4 decimals)? Use the value of the test statistic rounded to 2 decimal places in your calculations. c. Using a = 0.05, can it be concluded that the...
 eBook Exercise 9.13 (Algorithmic) Consider the following hypothesis test: но: 50 Ha: μ > 50 A sample of 55 is used and the population standard deviation is 7. Use the critical value approach to state your conclusion for each of the following sample results. Use a-.05 a. With x = 52.5, what is the value of the test statistic (to 2 decimals)? Can it be concluded that the population mean is greater than 50? Select your answer b. With x-51,...
 Consider the following hypotheses: Ho: μ s 57.1 HA: μ > 57.1 A sample of 22 observations yields a sample mean of 58.2. Assume that the sample is drawn from a normal population with a population standard deviation of 3.6. (You may find it useful to reference the appropriate table: z table or t table) a-1. Find the p-value. pvalue 20.10 Op-value0.01 0.01 s p-value<0.025 0.025 s p-value 0.05 0.05 s p-value<0.10 a-2. what is the conclusion if α-010? O...
 A test is made of Ho: μ-20 versus H 1 : μ * 20. A sample of size n-58 is drawn, and x-1 The population standard deviation isa . Part 4 out of 4 Sub Determine whether to reject Ho. Since the test statistic (select) in the critical region, we (select) α-0.05 level. Tim - Ho at the Since the test statistic (select) in the critical region, we (select) α 0.01 level. -Ho at the
Most questions answered within 3 hours.
-
A solid, uniform disk of radius 0.250 m and mass 53.7 kg rolls
down a ramp...
asked 2 hours ago -
Given the following table of high speed internet access vs.
annual home income:
Home Income
%...
asked 2 hours ago -
A baseball batter hits a 0.145kg baseball straight up into the
air. The baseball leaves the...
asked 3 hours ago -
An FM modulator is tested using
single-tone baseband signal with frequency of 50kHz and a sprectrum...
asked 3 hours ago -
Write the ionic equations for the first stage of salts
hydrolysis.
Anion, Cation?
Na2S
NiSO4
K2SO4...
asked 4 hours ago -
suppose there is a normally distributed population with a mean of
250 and a standard deviation...
asked 5 hours ago -
Question Three
Suppose you as project manager are using the Waterfall
development methodology on a large...
asked 6 hours ago -
Which statement is not true about welfare in Canada?
A.Benefits typically vary based on one's ability...
asked 7 hours ago -
Please help me with FLOWCHART and UML diagram for class,
thank you!
#include <iostream>
#include <fstream>...
asked 7 hours ago -
3. Describe the “logic circuit” of the Lac operon. Which
proteins are bound or not to...
asked 7 hours ago -
Ayesha’s adjusted gross income is $60,000 in 2019. She donated a
piece of artwork with a...
asked 8 hours ago -
For Dijkstra’s shortest path algorithm:
a. Give the Big-O time for Dijkstra’s shortest path algorithm
and...
asked 8 hours ago