

Homework Answers
Open market purchase of securities increase supply of reserves in the market and decreases interest rate from 5% to 4%.
Add Answer to:
The graph shows the demand curve for bank reserves, RD The cutrent quarfity of reserves supplied...
Federal funds rate (percent per year) The graph shows the demand curve for bank reserves, RD....
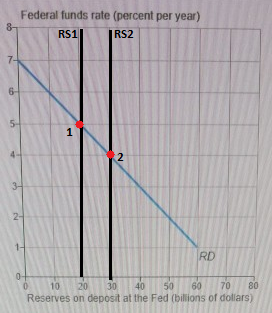
Federal funds rate (percent per year) The graph shows the demand curve for bank reserves, RD. The current quantity of reserves supplied is $20 billion. 7 Draw a point on the curve that shows the federal funds rate when the quantity of reserves supplied is $20 billion. Label it 1 6- 5- t 4 percent a year The Fed wants to set the federal funds rate Draw a supply of reserves curve that achieves the target. Label it Draw a...
, This Question: 1 pt The graph shows the demand curve for reserves in the market...
 ,
This Question: 1 pt The graph shows the demand curve for reserves in the market for bank reserves The federal funds target rate is 4 percent Draw the supply of reserves curve determined by the Fed to achieve the federal funds target rate Label it Draw a point at the equilibrium in the market for bank reserves If the Fed raises the Federal funds rate target they undertake an open market O A. purchase, increase O B. sale increase...
,
This Question: 1 pt The graph shows the demand curve for reserves in the market for bank reserves The federal funds target rate is 4 percent Draw the supply of reserves curve determined by the Fed to achieve the federal funds target rate Label it Draw a point at the equilibrium in the market for bank reserves If the Fed raises the Federal funds rate target they undertake an open market O A. purchase, increase O B. sale increase...
What is financial stability? What actions has the Fed taken since 2007 in pursuit of financial...
What is financial stability? What actions has the Fed taken since 2007 in pursuit of financial stability? Use a graph to illustrate the effects of the Fed's actions. Financial stability is a situation in which ______. A. financial markets and institutions function normally to allocate capital resources and risk B. all stock market indices experience daily positive growth C. the real interest rate is less than 3 percent a year D. the nominal interest rate is less than 5 percent...
136) Assuming all else equal, if a bank expects a bank run in the future: 136) A) there will be an upward movement along its demand curve for reserves. B) there will be a downward movement along its d...
136) Assuming all else equal, if a bank expects a bank run in the future: 136) A) there will be an upward movement along its demand curve for reserves. B) there will be a downward movement along its demand curve for reserves. C) its demand curve for reserves will shift to the right. D) its demand curve for reserves will shift to the left. 137) Which of the following will NOT cause a shift in the demand curve for reserves?...
Demand for Excess Reserves 6.5% 6.0% 5.5% 5.0% 4.5% 4.0% Federal Funds Rate 3.5% 3.0% 2.5%...
 Demand for Excess Reserves 6.5% 6.0% 5.5% 5.0% 4.5% 4.0% Federal Funds Rate 3.5% 3.0% 2.5% 2.0% 1.5% 1.0% 0.5% 0.0% o 100 200 300 400 500 600 700 800 900 1000 1100 1200 1300 $Billion The graph above shows the commercial banks' demand function for federal funds. The guy who was constructing this graph forgot to incorporate the effects of discount rate and interest on reserves into the graph. The discount rate is 4.50 percent and the interest on...
6) Draw a supply and demand for reserves graph where there is no discount lending and...
 6) Draw a supply and demand for reserves graph where there is no discount lending and no interest paid on reserves. Show and explain how the Fed could use open market operations to lower the equilibrium federal funds rate.
Interest rate (percent per year) 7- The figure shows the demand for money curve in Epsilon....
 Interest rate (percent per year) 7- The figure shows the demand for money curve in Epsilon. Draw the supply of money curve if the Fed wants the interest rate to be 6 percent a year. Label it. Draw a point at the equilibrium in the money market. 6- bonds. If the interest rate is 5 percent, people will Bond prices will 5- 4- O A. sell; rise OB. buy, fall O C. sell; fall OD. buy, rise MD The interest...
is this correct? please help The graph shows the aggregate supply curve and the aggregate demand...
 is this correct? please help
The graph shows the aggregate supply curve and the aggregate demand curve for an economy. Price level (GDP price index, 2009=100) Draw an aggregate demand curve that shows the effect of a $100 billion decrease in government expenditure and a $100 billion decrease in taxes occurring simultaneously. Label it AD. 0 0 ASO The balanced budget multiplier O A. is a negative number OB. equals zero O C. is a positive number OD. is sometimes...
is this correct? please help
The graph shows the aggregate supply curve and the aggregate demand curve for an economy. Price level (GDP price index, 2009=100) Draw an aggregate demand curve that shows the effect of a $100 billion decrease in government expenditure and a $100 billion decrease in taxes occurring simultaneously. Label it AD. 0 0 ASO The balanced budget multiplier O A. is a negative number OB. equals zero O C. is a positive number OD. is sometimes...
The following table shows the quantity of money supplied and the quantity of money demanded for various interest rates 4...
 The following table shows the quantity of money supplied and the
quantity of money demanded for various interest rates
4. Study Questions and Problems #4 The following table shows the quantity of money supplied and the quantity of money demanded for various interest rates. Interest Rate (Percent) Demand for Money (Billions of dollars) Supply of Money (Billions of dollars) 500 100 300 500 500 700 900 500 500 500 The following graph depicts the money supply curve in orange. On...
The following table shows the quantity of money supplied and the
quantity of money demanded for various interest rates
4. Study Questions and Problems #4 The following table shows the quantity of money supplied and the quantity of money demanded for various interest rates. Interest Rate (Percent) Demand for Money (Billions of dollars) Supply of Money (Billions of dollars) 500 100 300 500 500 700 900 500 500 500 The following graph depicts the money supply curve in orange. On...
RTDA: Graphing money market equilibrium :3 Question Help Real-Time Data Analysis Exercise* * Real-time data provided...
 RTDA: Graphing money market equilibrium :3 Question Help Real-Time Data Analysis Exercise* * Real-time data provided by Federal Reserve Economic Data (FRED), Federal Reserve Bank of Saint Louis. Interest rate (percent per year) 3.0407 In January 2020, the quantity of M2 was $15,438 billion and the nominal interest rate was 1.52 percent. 2.280 In the graph to the right, draw a point that shows the money market in January 2020 and label it A. Draw and label the M2 demand...
 ,
This Question: 1 pt The graph shows the demand curve for reserves in the market for bank reserves The federal funds target rate is 4 percent Draw the supply of reserves curve determined by the Fed to achieve the federal funds target rate Label it Draw a point at the equilibrium in the market for bank reserves If the Fed raises the Federal funds rate target they undertake an open market O A. purchase, increase O B. sale increase...
,
This Question: 1 pt The graph shows the demand curve for reserves in the market for bank reserves The federal funds target rate is 4 percent Draw the supply of reserves curve determined by the Fed to achieve the federal funds target rate Label it Draw a point at the equilibrium in the market for bank reserves If the Fed raises the Federal funds rate target they undertake an open market O A. purchase, increase O B. sale increase...
 Demand for Excess Reserves 6.5% 6.0% 5.5% 5.0% 4.5% 4.0% Federal Funds Rate 3.5% 3.0% 2.5% 2.0% 1.5% 1.0% 0.5% 0.0% o 100 200 300 400 500 600 700 800 900 1000 1100 1200 1300 $Billion The graph above shows the commercial banks' demand function for federal funds. The guy who was constructing this graph forgot to incorporate the effects of discount rate and interest on reserves into the graph. The discount rate is 4.50 percent and the interest on...
 6) Draw a supply and demand for reserves graph where there is no discount lending and no interest paid on reserves. Show and explain how the Fed could use open market operations to lower the equilibrium federal funds rate.
 Interest rate (percent per year) 7- The figure shows the demand for money curve in Epsilon. Draw the supply of money curve if the Fed wants the interest rate to be 6 percent a year. Label it. Draw a point at the equilibrium in the money market. 6- bonds. If the interest rate is 5 percent, people will Bond prices will 5- 4- O A. sell; rise OB. buy, fall O C. sell; fall OD. buy, rise MD The interest...
 is this correct? please help
The graph shows the aggregate supply curve and the aggregate demand curve for an economy. Price level (GDP price index, 2009=100) Draw an aggregate demand curve that shows the effect of a $100 billion decrease in government expenditure and a $100 billion decrease in taxes occurring simultaneously. Label it AD. 0 0 ASO The balanced budget multiplier O A. is a negative number OB. equals zero O C. is a positive number OD. is sometimes...
is this correct? please help
The graph shows the aggregate supply curve and the aggregate demand curve for an economy. Price level (GDP price index, 2009=100) Draw an aggregate demand curve that shows the effect of a $100 billion decrease in government expenditure and a $100 billion decrease in taxes occurring simultaneously. Label it AD. 0 0 ASO The balanced budget multiplier O A. is a negative number OB. equals zero O C. is a positive number OD. is sometimes...
 The following table shows the quantity of money supplied and the
quantity of money demanded for various interest rates
4. Study Questions and Problems #4 The following table shows the quantity of money supplied and the quantity of money demanded for various interest rates. Interest Rate (Percent) Demand for Money (Billions of dollars) Supply of Money (Billions of dollars) 500 100 300 500 500 700 900 500 500 500 The following graph depicts the money supply curve in orange. On...
The following table shows the quantity of money supplied and the
quantity of money demanded for various interest rates
4. Study Questions and Problems #4 The following table shows the quantity of money supplied and the quantity of money demanded for various interest rates. Interest Rate (Percent) Demand for Money (Billions of dollars) Supply of Money (Billions of dollars) 500 100 300 500 500 700 900 500 500 500 The following graph depicts the money supply curve in orange. On...
 RTDA: Graphing money market equilibrium :3 Question Help Real-Time Data Analysis Exercise* * Real-time data provided by Federal Reserve Economic Data (FRED), Federal Reserve Bank of Saint Louis. Interest rate (percent per year) 3.0407 In January 2020, the quantity of M2 was $15,438 billion and the nominal interest rate was 1.52 percent. 2.280 In the graph to the right, draw a point that shows the money market in January 2020 and label it A. Draw and label the M2 demand...
Most questions answered within 3 hours.
-
Explain some different types of fungi. State the different
divisions undergo by fungi.
asked 10 minutes ago -
The shortest time that 120 C can flow through a 20 A circuit
breaker without tripping...
asked 11 minutes ago -
A software design pattern is a general, reusable solution to a
commonly occurring problem, acting as...
asked 13 minutes ago -
The mean waiting time at the drive-through of a fast-food
restaurant from the time an order...
asked 30 minutes ago -
The pitch (p) of a helix is defined as p = dn, in which n is...
asked 32 minutes ago -
Do you agree that the declining stock of social capital is the
blame for the failure...
asked 35 minutes ago -
A researcher is interested in whether coffee consumption helps
with performance on reading comprehension tasks. The...
asked 45 minutes ago -
it has been estimated since the beginning of the human race that
about 133 metric ton...
asked 50 minutes ago -
Where must Medicare prescription drug plans allow for
participants to fill their prescriptions?
asked 54 minutes ago -
Five moles of monatomic ideal gas have initial pressure 2.50 ×
103 Pa and initial volume...
asked 1 hour ago -
A resistor and the capacitor are used to control the timing in
the RC circuit of...
asked 1 hour ago -
Living in a group could bring several disadvantages to an
individual. What are some of the...
asked 1 hour ago