
Homework Answers
![Soutions Given tha, Vfol D lo° P.u X :0.25 P. U MVA10 Q 1 j -Vg Vst Jrip jo 2-S SVst (Psttjs) - Vst [s4lvst -rо)] [vst-10 Qst](http://img.homeworklib.com/images/ee33c210-22ed-4a5f-927c-46852e7c96d4.png?x-oss-process=image/resize,w_560)
Add Answer to:
Consider the D-STATCOM shown in Figure 3. Assume that a six-pulse VSC operating on sinusoidal PWM...
Consider the D-STATCOM shown in Figure 3. Assume that a six-pulse VSC operating on sinusoidal PWM...
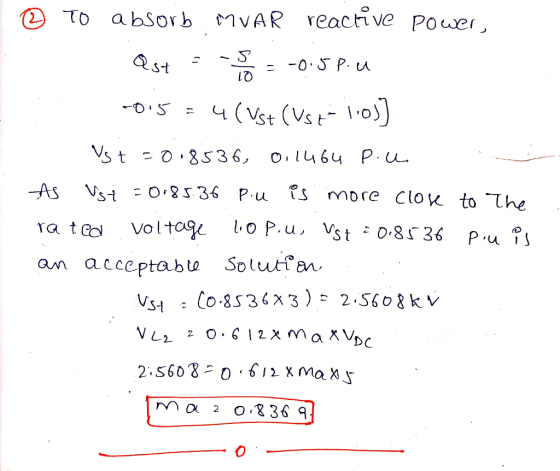
 Consider the D-STATCOM shown in Figure 3. Assume that a six-pulse VSC operating on sinusoidal PWM is employed for the D-STATCOM. Calculate the modulation index required: (1) to generate 5 Mvar of reactive power; and (2) to absorb 5 Mvar of reactive power. Data: For a six-pulse VSC oper =0.612 x ma x VDc where VLL is the line to line voltage at D-STATCOM terminals, ma is the modulation index and VDc is the DC capacitor voltage. Assume the base...
Problem 3: Sinusoidal PWM or Six-Step Control of three-phase DC-AC Inverter (45 Points) Design a three-phase...
 Problem 3: Sinusoidal PWM or Six-Step Control of three-phase DC-AC Inverter (45 Points) Design a three-phase inverter circuit for a solid oxide fuel cell, whose output voltage changes from 400 Vdc to 600 Vdc. Sinusoidal PWM (SPWM) A. If sinusoidal PWM is used to control the inverter, to obtain a three-phase 240 Vac (line- line RMS value) at 60 Hz, what is the inverter's modulation index (ma) range? (5points) B. Based on part A: Assume the fuel cell's output voltage...
The six-bus system shown in Figure 1 will be simulated using MATLAB. Transmission line data and b...
 The six-bus system shown in Figure 1 will be simulated using MATLAB. Transmission line data and bus data are given in Tables 1 and 2 respectively. The transmission line data are calculated on 100 MVA base and 230 (line-to-line) kV base for generator. Tasks: 1. Determine the network admittance matrix Y 2. Find the load flow solution using Gauss-Seidel/Newton Raphson method until first iteration by manual calculation. Use Maltab software to solve power flow problem using Gauss-Seidel method. Find the...
Consider the single line diagram of a 3-bus power system shown in Figure 2. Slack bus...
 Consider the single line diagram of a 3-bus power system shown in Figure 2. Slack bus 3 Figure 2. The data for this system are given in Tables 1 and 2. Bus Table 1 Generation Load Assumed PG QGPLQL bus voltage (MW) (MVar) (MW) (MVar) 1.05 +10.0 - - 1.0 + 0.0 50 30 305.6 140.2 1.0 +0.0 0.0 0.0 138.6 45.2 slack bus) Table 2 Bus-to-bus Impedance 0.2 + j0.04 .01 +0.03 2.3 0.0125 + j0.025 (0) Convert all...
 Consider the D-STATCOM shown in Figure 3. Assume that a six-pulse VSC operating on sinusoidal PWM is employed for the D-STATCOM. Calculate the modulation index required: (1) to generate 5 Mvar of reactive power; and (2) to absorb 5 Mvar of reactive power. Data: For a six-pulse VSC oper =0.612 x ma x VDc where VLL is the line to line voltage at D-STATCOM terminals, ma is the modulation index and VDc is the DC capacitor voltage. Assume the base...
 Problem 3: Sinusoidal PWM or Six-Step Control of three-phase DC-AC Inverter (45 Points) Design a three-phase inverter circuit for a solid oxide fuel cell, whose output voltage changes from 400 Vdc to 600 Vdc. Sinusoidal PWM (SPWM) A. If sinusoidal PWM is used to control the inverter, to obtain a three-phase 240 Vac (line- line RMS value) at 60 Hz, what is the inverter's modulation index (ma) range? (5points) B. Based on part A: Assume the fuel cell's output voltage...
 The six-bus system shown in Figure 1 will be simulated using MATLAB. Transmission line data and bus data are given in Tables 1 and 2 respectively. The transmission line data are calculated on 100 MVA base and 230 (line-to-line) kV base for generator. Tasks: 1. Determine the network admittance matrix Y 2. Find the load flow solution using Gauss-Seidel/Newton Raphson method until first iteration by manual calculation. Use Maltab software to solve power flow problem using Gauss-Seidel method. Find the...
 Consider the single line diagram of a 3-bus power system shown in Figure 2. Slack bus 3 Figure 2. The data for this system are given in Tables 1 and 2. Bus Table 1 Generation Load Assumed PG QGPLQL bus voltage (MW) (MVar) (MW) (MVar) 1.05 +10.0 - - 1.0 + 0.0 50 30 305.6 140.2 1.0 +0.0 0.0 0.0 138.6 45.2 slack bus) Table 2 Bus-to-bus Impedance 0.2 + j0.04 .01 +0.03 2.3 0.0125 + j0.025 (0) Convert all...
Most questions answered within 3 hours.
-
What advantages are there to using piperidine rather than
hydroxide as a base?
asked 1 minute from now -
Your friend tells you that there is a vending machine on campus
that dispenses M&M packs...
asked 48 seconds ago -
7. The life of a Freeze Breeze electric fan is normally
distributed with a mean 4...
asked 2 minutes ago -
1. A 751 mL NaCl solution is diluted to a volume of 1.06 L and a...
asked 7 minutes ago -
8
A $20,000 face value STRIPS is currently quoted at 38.642 and
has 8 years to...
asked 7 minutes ago -
The current exchange rate between the Japanese yen and
the US dollar is 120 yen per...
asked 9 minutes ago -
Marla’s Massages and More bought a special massage table two
years ago for $9,300. At the...
asked 16 minutes ago -
Suppose you require a peak output voltage of 15.0 V and have
available an AC source...
asked 16 minutes ago -
We
conduct A study to estimate the mean age of the population of women
at the...
asked 28 minutes ago -
.13 : Assume that we make an enhancement to a computer that
improves some mode of...
asked 29 minutes ago -
4)
Find the tension in an elevator cable if the 1000 kg elevator is
descending with...
asked 35 minutes ago -
A random sample of 51 newborn babies was taken at the Hospital.
The sample mean was...
asked 33 minutes ago