


c) Calculate the standard deviation of the ages for the Last Six U.S. Presidents by hand by answering the following questions and filling in the table. We will want our final answer to be correct to 3 decimal places. So, to make sure we don't get any rounding error, we will do all calculations to 6 decimal places until the final answer. ( point each) Round each answer to 6 decimal places. What is the mean age (X) of the Last Six Presidents? Round your answer to 6 decimal places. Mean = HINT: You are strongly encouraged to verify this calculation using your calculator Fill in the following values in the table using the rounded mean you got in the question above Round each an5wer to 6 decimal places. (х — X)? Last Six Presidents Age Jimmy Carter 52 Ronald Reagan 69 George H.W. Bush 64 Bill Clinton 46 George W. Bush 54 Barack Obama 47 SUM the Last Six Presidents? (4 points) What is the standard deviation Round your answer to 3 decimal places needed Standard Deviation HINT: You are strongly encouraged to verify this calculation using your calculator
4) A botanist opened a sample of 50 bean pods and counted the number of beans in each pod. The results obtained were as follows: 4 0 4 5 4 4 4 4 4 4 2 4 1 4 4 0 4 6 2. C 4 a) Fill in the frequency table for these data. (2 points each) Number of Beans in Pod Number of Bean Pods 1 4 4 6 b) Determine the mode of the data. (5 points) Mode = Round your answer to 2 decimal places as needed. ..
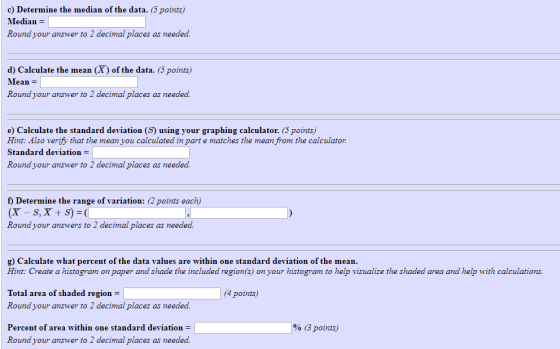
c) Determine the median of the data. (5 points) Median =| Round your answer to 2 decimal places as needed. d) Calculate the mean (X) of the data. (5 points) Mean Round your answer to decimal places as needed. e) Calculate the standard deviation (S) using your graphing calculator. (5 points) Hint: Also verify that the mean you calculated in part e matches the mean from the calculator. Standard deviation = Round your answer to 2 decimal places as needed. f) Determine the range of variation: (2 points each) (X - S, X S) = ( | Round your answers to 2 decimal places as needed. g) culate what percent of Hint: Create a histogram on paper and shade the included region(s) on your histogram to help visualize the shaded area and help with calculations. data valu are withi tion tl mean one sta Total area of shaded region = Round your answer to 2 decimal places as needed. (4 points) % (3 points) Percent of area within one standard deviation = Round your answer to 2 decimal places as needed.
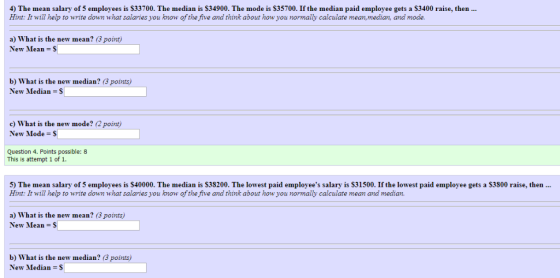
4) The mean salary of 5 employees is $33700. The median is $34900. The mode is $35700. If the median paid employee gets a $3400 raise, then ... Hint: It will help to write down what salaries you know of the five and think about how you normally calculate mean, median, and mode. a) What is the new mean? (3 point) New Mean S b) What is the new median? (3 points) New Median S c) What is the new mode? (2 point) New Mode $ Question 4. Points possible: 8 This is attempt 1 of 1. 5) The mean salary of 5 employees is S40000. The median is S38200. The lowest paid employee's salary is S31500. If the lowest paid employee gets a $3800 raise, then ... Hint: It will help to write down what salaries you know of the five and think about how you normally calculate mean and median. a) What is the new mean? (3 points) New Mean S b) What is the new median? (3 points) New Median = $
6) The mean salary of 5 employees is $41100. The employee salaries have 2 modes: $31500 and $49500. If the median salary gets a $2900 raise, then ... Hint: It will help to write down what salaries you know of the five and think about how you normally calculate mean and median.. a) What is the new mean? (3 point) New Mean $ b) What is the new median? (3 points) New Median S
Homework Answers


4(a)
| No. of Beans in Pod | No. of Bean Pods |
| 0 | 11 |
| 1 | 5 |
| 2 | 4 |
| 3 | 3 |
| 4 | 15 |
| 5 | 9 |
| 6 | 3 |

Add Answer to:
b) Calculate the standard deviation of the ages for the First Six U.S. Presidents by hand...
4) A botanist opened a sample of 50 bean pods and counted the number of beans in each pod. The re...
 PLEASE ANSWER ALL OF THE PARTS
4) A botanist opened a sample of 50 bean pods and counted the number of beans in each pod. The results obtained were as follows: 212 5 0 0165 1 6 5 3 3 611 6 65 1031320156 e) Calculate the standard deviation (S) using your graphing calculator. (5 points) Hint: Also verify that the mean you calculated in part e matches the mean from the calculator. Standard deviation- f) Determine the range of...
PLEASE ANSWER ALL OF THE PARTS
4) A botanist opened a sample of 50 bean pods and counted the number of beans in each pod. The results obtained were as follows: 212 5 0 0165 1 6 5 3 3 611 6 65 1031320156 e) Calculate the standard deviation (S) using your graphing calculator. (5 points) Hint: Also verify that the mean you calculated in part e matches the mean from the calculator. Standard deviation- f) Determine the range of...
PLEASE help me with the answers for b, c, and d! Especially d (you do not have to create a histogram for me)! Thank you so much!!! 4) You've been elected to the board, and to gather some inf...
 PLEASE help me with the answers for b, c, and d! Especially d (you
do not have to create a histogram for me)! Thank you so much!!!
4) You've been elected to the board, and to gather some information, you send out a survey to all residents about how often they think the board should meet each quarter. You get the following 60 responses: 4 2 3 2 443 3 344 4 4 2 3 2 2 4 44 34...
PLEASE help me with the answers for b, c, and d! Especially d (you
do not have to create a histogram for me)! Thank you so much!!!
4) You've been elected to the board, and to gather some information, you send out a survey to all residents about how often they think the board should meet each quarter. You get the following 60 responses: 4 2 3 2 443 3 344 4 4 2 3 2 2 4 44 34...
Describe the variance and standard deviation ing For the following scores, find the (a) mean. (b)...
 Describe the variance and standard deviation
ing For the following scores, find the (a) mean. (b) median, (c) sum of squared deviations (a) variance, and (e) standard deviation 5, 0, 5, 4, 5, 1, 0, 2, 1, 3, 3, 3, 4, 5, 1, 2, 2, 2,2, 1,2 o M-2524 (Round to three decimal places as needed) (b) Find the median. Median 2 (Round to three decimal places as needed) (c) Find the sum of squared deviations. Enter your answer in...
Describe the variance and standard deviation
ing For the following scores, find the (a) mean. (b) median, (c) sum of squared deviations (a) variance, and (e) standard deviation 5, 0, 5, 4, 5, 1, 0, 2, 1, 3, 3, 3, 4, 5, 1, 2, 2, 2,2, 1,2 o M-2524 (Round to three decimal places as needed) (b) Find the median. Median 2 (Round to three decimal places as needed) (c) Find the sum of squared deviations. Enter your answer in...
PLEASE ANSWER ALL PARTS ! thank you so much ! 4) You've been elected to the...
 PLEASE ANSWER ALL PARTS !
thank you so much !
4) You've been elected to the board, and to gather some information, you send out a survey to al residents about how often they think the board should meet each quarter. You get the following 60 responses: 2 1 3 2411 3 31 1 4 3 4 3 3 2 4332 422243 4 4 23143 3 4 13113 2 | 2 a) Fill in the frequency table for these data....
PLEASE ANSWER ALL PARTS !
thank you so much !
4) You've been elected to the board, and to gather some information, you send out a survey to al residents about how often they think the board should meet each quarter. You get the following 60 responses: 2 1 3 2411 3 31 1 4 3 4 3 3 2 4332 422243 4 4 23143 3 4 13113 2 | 2 a) Fill in the frequency table for these data....
Question 17 The mean of a distribution is 20 and the standard deviation is 2. At...
Question 17 The mean of a distribution is 20 and the standard deviation is 2. At least what percentage of the values will fall between 10 and 30? Do not round the percentage. Blank 1 % Question 18 The exam scores of 20 students were recorded as follows: 73, 87, 62, 98, 43, 90, 88, 97, 100, 87, 95, 100, 56, 78, 100, 88, 70, 78, 63, 78 Find the MODE. If there is no mode, type No Mode. If...
Having a hard time with the variance and standard deviation. Please help! Thank you!!! Check my...
 Having a hard time with the variance and standard deviation. Please
help! Thank you!!!
Check my work mode : This shows what is correct or incorrect for the work you have completed so far. It does not indicate completion. Return to quer 3 Calculate the mean, the variance, and the standard deviation of the following discrete probability distribution. (Negative values should be indicated by a minus sign. Round intermediate calculetions to at least 4 decimal places. Round your final answers...
Having a hard time with the variance and standard deviation. Please
help! Thank you!!!
Check my work mode : This shows what is correct or incorrect for the work you have completed so far. It does not indicate completion. Return to quer 3 Calculate the mean, the variance, and the standard deviation of the following discrete probability distribution. (Negative values should be indicated by a minus sign. Round intermediate calculetions to at least 4 decimal places. Round your final answers...
Lab Assignment: Chapter 14 (Statistics Revie...i Saved Help Save & Exit Submit Required information Consider the...
 Lab Assignment: Chapter 14 (Statistics Revie...i Saved Help Save & Exit Submit Required information Consider the given data. 29.65 29.75 30.85 29.25 28.75 28.55 28.65 30.15 29.35 29.05 30.25 30.65 28.15 29.85 29.65 30.45 29.15 30.45 33.65 29.35 29.75 29.45 29.25 31.25 30.15 29.65 30.55 29.65 eBook Hint termine and display Develop an M-file function to compute descriptive statistics for a vector of values. number of values, mean, median, mode, range, standard deviation, variance, and coefficient of variation. Determine the...
Directions: Calculate the mean, median, mode, range, variance, and standard deviation (SD) for each set of...
Directions: Calculate the mean, median, mode, range, variance, and standard deviation (SD) for each set of data. Please show your work on a separate sheet of paper and submit it along with this worksheet. Make sure your name is on the separate sheet. All answers must be written on this sheet. 1. Data Set: 1, 3, 1, 5, 7, 2, 4, 1, 3, 6, 2, 5, 2, 6, 8, 8, 2, 1, and 3 Mean = _____ Median=_____ Mode=_____ ...
table 2.73 calculate the mean median standard deviation the first quartile the third quartile and the...
 table 2.73 calculate the mean median standard
deviation the first quartile the third quartile and the Iqr round
to one decimal place
95. 75% of all years have an FTES: a. at or below: b. at or above: 96. The population standard deviation = 97. What percent of the FTES were from 528.5 to 1447.5? How do you know? 98. What is the IQR? What does the IQR represent? 99. How many standard deviations away from the mean is the...
table 2.73 calculate the mean median standard
deviation the first quartile the third quartile and the Iqr round
to one decimal place
95. 75% of all years have an FTES: a. at or below: b. at or above: 96. The population standard deviation = 97. What percent of the FTES were from 528.5 to 1447.5? How do you know? 98. What is the IQR? What does the IQR represent? 99. How many standard deviations away from the mean is the...
 PLEASE ANSWER ALL OF THE PARTS
4) A botanist opened a sample of 50 bean pods and counted the number of beans in each pod. The results obtained were as follows: 212 5 0 0165 1 6 5 3 3 611 6 65 1031320156 e) Calculate the standard deviation (S) using your graphing calculator. (5 points) Hint: Also verify that the mean you calculated in part e matches the mean from the calculator. Standard deviation- f) Determine the range of...
PLEASE ANSWER ALL OF THE PARTS
4) A botanist opened a sample of 50 bean pods and counted the number of beans in each pod. The results obtained were as follows: 212 5 0 0165 1 6 5 3 3 611 6 65 1031320156 e) Calculate the standard deviation (S) using your graphing calculator. (5 points) Hint: Also verify that the mean you calculated in part e matches the mean from the calculator. Standard deviation- f) Determine the range of...
 PLEASE help me with the answers for b, c, and d! Especially d (you
do not have to create a histogram for me)! Thank you so much!!!
4) You've been elected to the board, and to gather some information, you send out a survey to all residents about how often they think the board should meet each quarter. You get the following 60 responses: 4 2 3 2 443 3 344 4 4 2 3 2 2 4 44 34...
PLEASE help me with the answers for b, c, and d! Especially d (you
do not have to create a histogram for me)! Thank you so much!!!
4) You've been elected to the board, and to gather some information, you send out a survey to all residents about how often they think the board should meet each quarter. You get the following 60 responses: 4 2 3 2 443 3 344 4 4 2 3 2 2 4 44 34...
 Describe the variance and standard deviation
ing For the following scores, find the (a) mean. (b) median, (c) sum of squared deviations (a) variance, and (e) standard deviation 5, 0, 5, 4, 5, 1, 0, 2, 1, 3, 3, 3, 4, 5, 1, 2, 2, 2,2, 1,2 o M-2524 (Round to three decimal places as needed) (b) Find the median. Median 2 (Round to three decimal places as needed) (c) Find the sum of squared deviations. Enter your answer in...
Describe the variance and standard deviation
ing For the following scores, find the (a) mean. (b) median, (c) sum of squared deviations (a) variance, and (e) standard deviation 5, 0, 5, 4, 5, 1, 0, 2, 1, 3, 3, 3, 4, 5, 1, 2, 2, 2,2, 1,2 o M-2524 (Round to three decimal places as needed) (b) Find the median. Median 2 (Round to three decimal places as needed) (c) Find the sum of squared deviations. Enter your answer in...
 PLEASE ANSWER ALL PARTS !
thank you so much !
4) You've been elected to the board, and to gather some information, you send out a survey to al residents about how often they think the board should meet each quarter. You get the following 60 responses: 2 1 3 2411 3 31 1 4 3 4 3 3 2 4332 422243 4 4 23143 3 4 13113 2 | 2 a) Fill in the frequency table for these data....
PLEASE ANSWER ALL PARTS !
thank you so much !
4) You've been elected to the board, and to gather some information, you send out a survey to al residents about how often they think the board should meet each quarter. You get the following 60 responses: 2 1 3 2411 3 31 1 4 3 4 3 3 2 4332 422243 4 4 23143 3 4 13113 2 | 2 a) Fill in the frequency table for these data....
 Having a hard time with the variance and standard deviation. Please
help! Thank you!!!
Check my work mode : This shows what is correct or incorrect for the work you have completed so far. It does not indicate completion. Return to quer 3 Calculate the mean, the variance, and the standard deviation of the following discrete probability distribution. (Negative values should be indicated by a minus sign. Round intermediate calculetions to at least 4 decimal places. Round your final answers...
Having a hard time with the variance and standard deviation. Please
help! Thank you!!!
Check my work mode : This shows what is correct or incorrect for the work you have completed so far. It does not indicate completion. Return to quer 3 Calculate the mean, the variance, and the standard deviation of the following discrete probability distribution. (Negative values should be indicated by a minus sign. Round intermediate calculetions to at least 4 decimal places. Round your final answers...
 Lab Assignment: Chapter 14 (Statistics Revie...i Saved Help Save & Exit Submit Required information Consider the given data. 29.65 29.75 30.85 29.25 28.75 28.55 28.65 30.15 29.35 29.05 30.25 30.65 28.15 29.85 29.65 30.45 29.15 30.45 33.65 29.35 29.75 29.45 29.25 31.25 30.15 29.65 30.55 29.65 eBook Hint termine and display Develop an M-file function to compute descriptive statistics for a vector of values. number of values, mean, median, mode, range, standard deviation, variance, and coefficient of variation. Determine the...
 table 2.73 calculate the mean median standard
deviation the first quartile the third quartile and the Iqr round
to one decimal place
95. 75% of all years have an FTES: a. at or below: b. at or above: 96. The population standard deviation = 97. What percent of the FTES were from 528.5 to 1447.5? How do you know? 98. What is the IQR? What does the IQR represent? 99. How many standard deviations away from the mean is the...
table 2.73 calculate the mean median standard
deviation the first quartile the third quartile and the Iqr round
to one decimal place
95. 75% of all years have an FTES: a. at or below: b. at or above: 96. The population standard deviation = 97. What percent of the FTES were from 528.5 to 1447.5? How do you know? 98. What is the IQR? What does the IQR represent? 99. How many standard deviations away from the mean is the...
Most questions answered within 3 hours.
-
Calculate the number density of argon gas at a temperature of
24C and a pressure of...
asked 1 hour ago -
Alternative
Classification
How to Estimate
Probabilities from Data? ( For continuous Attributes)
And How to generate...
asked 1 hour ago -
An explosion breaks a 20.0-kg object into three parts. The
object is initially moving at a...
asked 1 hour ago -
Calculate the approximate number of residues of Rubisco, which
is involved in carbon fixation in plants,...
asked 2 hours ago -
Other decisions about scientific claims can have a much broader
impact.ENERGYarrow-10x10.png, environment, health, security - all...
asked 3 hours ago -
I need to write a research paper and work cited about this
topic: The United States...
asked 4 hours ago -
Hello! I was wondering if I could have some help?
If the vapor pressure of carvone...
asked 4 hours ago -
An economist wants to estimate the mean per capita income (in
thousands of dollars) for a...
asked 4 hours ago -
What would be the input/output characteristic of a circuit
obtained by putting two of your 2's-complementers...
asked 4 hours ago -
In Drosophila, the transition from the syncytial blastoderm
stage to the cellular blastoderm stage is a...
asked 5 hours ago -
Project management question:
Name 3 different types of resources (hint: humans are one
type)
asked 5 hours ago -
Consider the following reaction: C 2H 2( g) + 2H 2( g) C 2H 6(
g)...
asked 5 hours ago