
Please Solove only (a)and (b)
Please, Write so that I can recognize
Homework Answers


Add Answer to:
Please Solove only (a)and (b) Please, Write so that I can recognize 4.20 Consider the system...
Can someone please explain why they only considered 0,2 and 5 as their frequencies and didn't inc...
 can someone please explain why they only considered 0,2 and 5 as
their frequencies and didn't include -2 and -5? Also, how did they
get the angles for the changes column? please explain with steps.
thank you
1. (i) (8 pts) The input signal z(t) to a continuous time (CT) linear time-invariant (LTI) system is given by x(t) 12 cos 2t +sin 5t The output y(t) is found to be given by y(t) 3-4 sin 2t 0.5 sin 5t At...
can someone please explain why they only considered 0,2 and 5 as
their frequencies and didn't include -2 and -5? Also, how did they
get the angles for the changes column? please explain with steps.
thank you
1. (i) (8 pts) The input signal z(t) to a continuous time (CT) linear time-invariant (LTI) system is given by x(t) 12 cos 2t +sin 5t The output y(t) is found to be given by y(t) 3-4 sin 2t 0.5 sin 5t At...
Please, Write so that I can recognize. 4.18 An LTI system has the impulse response sin(2mt)...
 Please, Write so that I can recognize.
4.18 An LTI system has the impulse response sin(2mt) h(t) 2 cos(7t) t Use the FT to determine the system output if the input is (a) x(t) cos(2 t)sin(6rt) t 7 1 -1 8 (a) 00 T
4.18 An LTI system has the impulse response sin(2mt) h(t) 2 cos(7t) t Use the FT to determine the system output if the input is (a) x(t) cos(2 t)sin(6rt)
t 7 1 -1 8 (a) 00...
Please, Write so that I can recognize.
4.18 An LTI system has the impulse response sin(2mt) h(t) 2 cos(7t) t Use the FT to determine the system output if the input is (a) x(t) cos(2 t)sin(6rt) t 7 1 -1 8 (a) 00 T
4.18 An LTI system has the impulse response sin(2mt) h(t) 2 cos(7t) t Use the FT to determine the system output if the input is (a) x(t) cos(2 t)sin(6rt)
t 7 1 -1 8 (a) 00...
please show steps, focus on part b more 1. (23 points) Sampling and Aliasing. (a) Find...
 please show steps, focus on part b more
1. (23 points) Sampling and Aliasing. (a) Find the Nyquist sampling rate wn for the given x(t). (Recall that the sampling frequency has to be twice larger than the bandwidth of the signal to recover the signal without loss of information.) i. (5 pts) X(t) = sinc(5000) * cos(7t). ii. (5 pts) r(t) = sin(101) cos(106) iii. (5 pts) (t) = sinc(50000) + cos(56) (b) (8 pts) Let r(t) = sinc(t/h), y(t)...
please show steps, focus on part b more
1. (23 points) Sampling and Aliasing. (a) Find the Nyquist sampling rate wn for the given x(t). (Recall that the sampling frequency has to be twice larger than the bandwidth of the signal to recover the signal without loss of information.) i. (5 pts) X(t) = sinc(5000) * cos(7t). ii. (5 pts) r(t) = sin(101) cos(106) iii. (5 pts) (t) = sinc(50000) + cos(56) (b) (8 pts) Let r(t) = sinc(t/h), y(t)...
Question Systems: Consider the following system for the questions below (indicate relevant transition points and peak...
 Question Systems: Consider the following system for the questions below (indicate relevant transition points and peak values when drawing frequency domain representations). Note that X (jw) is the frequency domain representation of the input and both filters use a scaled version of the filter, H(jw). y(t) x(t)- H(w) H(jw) cos(2w.t) H(w) W(0) -Wo Wo X(jw) -2wo-WOW O 2w, a) Draw the frequency response of the output of the first signal path, Y. (jw) b) Draw the frequency response of the...
number 2 ECE 300 Continuous-Time Signals and Systems H(jø π/2 Plot the spectrum Z (jø) of the filtered input signal z()...
 number 2
ECE 300 Continuous-Time Signals and Systems H(jø π/2 Plot the spectrum Z (jø) of the filtered input signal z(), the spectrum Z, (jo) of the sampled signal z.(t), and the spectrum Y(ja) of the reconstructed signal y(t). Show clearly how the output spectrum Y (ja) differs from the original spectrum G(jo) C. Which system, A or B, produces less distortion between the input g(t) and the output y(4) or ()? Explain. You can measure distortion by finding the...
number 2
ECE 300 Continuous-Time Signals and Systems H(jø π/2 Plot the spectrum Z (jø) of the filtered input signal z(), the spectrum Z, (jo) of the sampled signal z.(t), and the spectrum Y(ja) of the reconstructed signal y(t). Show clearly how the output spectrum Y (ja) differs from the original spectrum G(jo) C. Which system, A or B, produces less distortion between the input g(t) and the output y(4) or ()? Explain. You can measure distortion by finding the...
solve 2.40 a,b,c, e using Fourier series. 2.40 part a,b,c,e 2.40 Consider the continuous-time signals depicted in Fig. P2.40. Evaluate the following convolution integrals: (a) m(t) x(t) y(t) (...
 solve 2.40 a,b,c, e using Fourier series.
2.40 part a,b,c,e 2.40 Consider the continuous-time signals depicted in Fig. P2.40. Evaluate the following convolution integrals: (a) m(t) x(t) y(t) (b) m(t)x(t)z(t) (c) m(t) x(t) ft) (d) m(t) x(t) a(t) (e) m(t)y(t) z(t) (f) m(t) -y(t) w(t) (g) m(t) y(t)g(t) (h) m(t)y(t) c(t) (i) m(t) z(t) f(t) (j) m(t) z(t) g(t) (k) m(t) z(t)b(t) (1) m(t) w(t) g(t) (m) m(t) w(t) a(t) (n) m(t) f(t) g(t (o) m(t) fo) . do) (p)...
solve 2.40 a,b,c, e using Fourier series.
2.40 part a,b,c,e 2.40 Consider the continuous-time signals depicted in Fig. P2.40. Evaluate the following convolution integrals: (a) m(t) x(t) y(t) (b) m(t)x(t)z(t) (c) m(t) x(t) ft) (d) m(t) x(t) a(t) (e) m(t)y(t) z(t) (f) m(t) -y(t) w(t) (g) m(t) y(t)g(t) (h) m(t)y(t) c(t) (i) m(t) z(t) f(t) (j) m(t) z(t) g(t) (k) m(t) z(t)b(t) (1) m(t) w(t) g(t) (m) m(t) w(t) a(t) (n) m(t) f(t) g(t (o) m(t) fo) . do) (p)...
6.) In part (a) of the figure below, h(t) is the impulse response of a LTI...
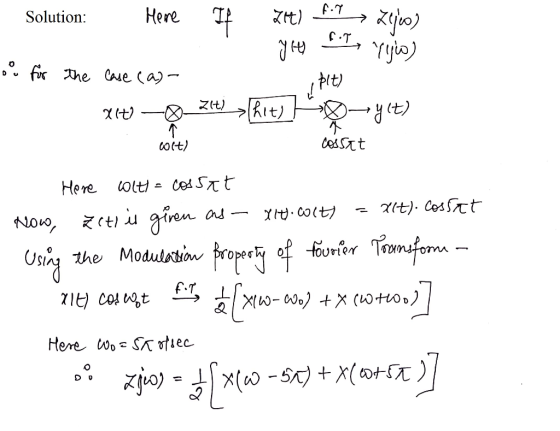
 6.) In part (a) of the figure below, h(t) is the impulse response of a LTI system with input g(t) x(t)w(t), and input x(t) has FT X(ao) shown in part (b) of the figure. The circled "X" means multiplication X(0) g(t) (X) (X УС) h(t) 1 w(t) cos(5nt) л (a) b) Sketch the FT G(0) of g(t) and the FT Y(o) of y(t for the following cases: cos(5nt) and h(t)= Sin(6m) a) w(t) sin(5z) b) w() cos(5tt) and h(t) =
Please finish these questions. Thank you Given find the Fourier transform of the following: (a) e dt 2T(2 1) 4 cos (2t) (Using properties of Fourier Transform to find) a) Suppose a signal m(t) is giv...
 Please finish these questions. Thank you
Given find the Fourier transform of the following: (a) e dt 2T(2 1) 4 cos (2t) (Using properties of Fourier Transform to find) a) Suppose a signal m(t) is given by m()-1+sin(2 fm) where fm-10 Hz. Sketch the signal m(t) in time domain b) Find the Fourier transform M(jo) of m(t) and sketch the magnitude of M(jo) c) If m(t) is amplitude modulated with a carrier signal by x(t)-m(t)cos(27r f,1) (where fe-1000 Hz), sketch...
Please finish these questions. Thank you
Given find the Fourier transform of the following: (a) e dt 2T(2 1) 4 cos (2t) (Using properties of Fourier Transform to find) a) Suppose a signal m(t) is given by m()-1+sin(2 fm) where fm-10 Hz. Sketch the signal m(t) in time domain b) Find the Fourier transform M(jo) of m(t) and sketch the magnitude of M(jo) c) If m(t) is amplitude modulated with a carrier signal by x(t)-m(t)cos(27r f,1) (where fe-1000 Hz), sketch...
Problem 17. Consider the standard amplitude-modulation system shown in Figure 3 Figure 3 x) Chann...
 Analysis Linear Systems
Problem 17. Consider the standard amplitude-modulation system shown in Figure 3 Figure 3 x) Channel Filter he(r) cos wor cos ωοι M(w) H(u) (a) Sketch the spectrum of r(t). (b) Sketch the spectrum of y(t) for the following cases: (i) 0S WcWo-m (iii) wc >wowm (c) Sketch the spectrum of z(t) for the following cases: (i) 0 S WcWo-m (iii) wc >wowm d) Sketch the spectrum of v(t) if we wowm and (i) w
Analysis Linear Systems
Problem 17. Consider the standard amplitude-modulation system shown in Figure 3 Figure 3 x) Channel Filter he(r) cos wor cos ωοι M(w) H(u) (a) Sketch the spectrum of r(t). (b) Sketch the spectrum of y(t) for the following cases: (i) 0S WcWo-m (iii) wc >wowm (c) Sketch the spectrum of z(t) for the following cases: (i) 0 S WcWo-m (iii) wc >wowm d) Sketch the spectrum of v(t) if we wowm and (i) w
3. The system represented by the block diagram below modulates the message signal x(t) with a carrier wave c(t) to yield -(). The signal y(t) is generated by multiplying z() by the carrier wave c(t)....
 3. The system represented by the block diagram below modulates the message signal x(t) with a carrier wave c(t) to yield -(). The signal y(t) is generated by multiplying z() by the carrier wave c(t). c(t) c(t) y(t) z(t) The output signal,y(t), can be written as y(t)-C() × X() x C(t). Using the properties of a) Fourier Transforms, write Yi) in terms of Cjo) and Yj). [2 points] The Fourier Transform of x(t) is illustrated below. 0.9 0.8 0.7 0.6...
 can someone please explain why they only considered 0,2 and 5 as
their frequencies and didn't include -2 and -5? Also, how did they
get the angles for the changes column? please explain with steps.
thank you
1. (i) (8 pts) The input signal z(t) to a continuous time (CT) linear time-invariant (LTI) system is given by x(t) 12 cos 2t +sin 5t The output y(t) is found to be given by y(t) 3-4 sin 2t 0.5 sin 5t At...
can someone please explain why they only considered 0,2 and 5 as
their frequencies and didn't include -2 and -5? Also, how did they
get the angles for the changes column? please explain with steps.
thank you
1. (i) (8 pts) The input signal z(t) to a continuous time (CT) linear time-invariant (LTI) system is given by x(t) 12 cos 2t +sin 5t The output y(t) is found to be given by y(t) 3-4 sin 2t 0.5 sin 5t At...
 Please, Write so that I can recognize.
4.18 An LTI system has the impulse response sin(2mt) h(t) 2 cos(7t) t Use the FT to determine the system output if the input is (a) x(t) cos(2 t)sin(6rt) t 7 1 -1 8 (a) 00 T
4.18 An LTI system has the impulse response sin(2mt) h(t) 2 cos(7t) t Use the FT to determine the system output if the input is (a) x(t) cos(2 t)sin(6rt)
t 7 1 -1 8 (a) 00...
Please, Write so that I can recognize.
4.18 An LTI system has the impulse response sin(2mt) h(t) 2 cos(7t) t Use the FT to determine the system output if the input is (a) x(t) cos(2 t)sin(6rt) t 7 1 -1 8 (a) 00 T
4.18 An LTI system has the impulse response sin(2mt) h(t) 2 cos(7t) t Use the FT to determine the system output if the input is (a) x(t) cos(2 t)sin(6rt)
t 7 1 -1 8 (a) 00...
 please show steps, focus on part b more
1. (23 points) Sampling and Aliasing. (a) Find the Nyquist sampling rate wn for the given x(t). (Recall that the sampling frequency has to be twice larger than the bandwidth of the signal to recover the signal without loss of information.) i. (5 pts) X(t) = sinc(5000) * cos(7t). ii. (5 pts) r(t) = sin(101) cos(106) iii. (5 pts) (t) = sinc(50000) + cos(56) (b) (8 pts) Let r(t) = sinc(t/h), y(t)...
please show steps, focus on part b more
1. (23 points) Sampling and Aliasing. (a) Find the Nyquist sampling rate wn for the given x(t). (Recall that the sampling frequency has to be twice larger than the bandwidth of the signal to recover the signal without loss of information.) i. (5 pts) X(t) = sinc(5000) * cos(7t). ii. (5 pts) r(t) = sin(101) cos(106) iii. (5 pts) (t) = sinc(50000) + cos(56) (b) (8 pts) Let r(t) = sinc(t/h), y(t)...
 Question Systems: Consider the following system for the questions below (indicate relevant transition points and peak values when drawing frequency domain representations). Note that X (jw) is the frequency domain representation of the input and both filters use a scaled version of the filter, H(jw). y(t) x(t)- H(w) H(jw) cos(2w.t) H(w) W(0) -Wo Wo X(jw) -2wo-WOW O 2w, a) Draw the frequency response of the output of the first signal path, Y. (jw) b) Draw the frequency response of the...
 number 2
ECE 300 Continuous-Time Signals and Systems H(jø π/2 Plot the spectrum Z (jø) of the filtered input signal z(), the spectrum Z, (jo) of the sampled signal z.(t), and the spectrum Y(ja) of the reconstructed signal y(t). Show clearly how the output spectrum Y (ja) differs from the original spectrum G(jo) C. Which system, A or B, produces less distortion between the input g(t) and the output y(4) or ()? Explain. You can measure distortion by finding the...
number 2
ECE 300 Continuous-Time Signals and Systems H(jø π/2 Plot the spectrum Z (jø) of the filtered input signal z(), the spectrum Z, (jo) of the sampled signal z.(t), and the spectrum Y(ja) of the reconstructed signal y(t). Show clearly how the output spectrum Y (ja) differs from the original spectrum G(jo) C. Which system, A or B, produces less distortion between the input g(t) and the output y(4) or ()? Explain. You can measure distortion by finding the...
 solve 2.40 a,b,c, e using Fourier series.
2.40 part a,b,c,e 2.40 Consider the continuous-time signals depicted in Fig. P2.40. Evaluate the following convolution integrals: (a) m(t) x(t) y(t) (b) m(t)x(t)z(t) (c) m(t) x(t) ft) (d) m(t) x(t) a(t) (e) m(t)y(t) z(t) (f) m(t) -y(t) w(t) (g) m(t) y(t)g(t) (h) m(t)y(t) c(t) (i) m(t) z(t) f(t) (j) m(t) z(t) g(t) (k) m(t) z(t)b(t) (1) m(t) w(t) g(t) (m) m(t) w(t) a(t) (n) m(t) f(t) g(t (o) m(t) fo) . do) (p)...
solve 2.40 a,b,c, e using Fourier series.
2.40 part a,b,c,e 2.40 Consider the continuous-time signals depicted in Fig. P2.40. Evaluate the following convolution integrals: (a) m(t) x(t) y(t) (b) m(t)x(t)z(t) (c) m(t) x(t) ft) (d) m(t) x(t) a(t) (e) m(t)y(t) z(t) (f) m(t) -y(t) w(t) (g) m(t) y(t)g(t) (h) m(t)y(t) c(t) (i) m(t) z(t) f(t) (j) m(t) z(t) g(t) (k) m(t) z(t)b(t) (1) m(t) w(t) g(t) (m) m(t) w(t) a(t) (n) m(t) f(t) g(t (o) m(t) fo) . do) (p)...
 6.) In part (a) of the figure below, h(t) is the impulse response of a LTI system with input g(t) x(t)w(t), and input x(t) has FT X(ao) shown in part (b) of the figure. The circled "X" means multiplication X(0) g(t) (X) (X УС) h(t) 1 w(t) cos(5nt) л (a) b) Sketch the FT G(0) of g(t) and the FT Y(o) of y(t for the following cases: cos(5nt) and h(t)= Sin(6m) a) w(t) sin(5z) b) w() cos(5tt) and h(t) =
 Please finish these questions. Thank you
Given find the Fourier transform of the following: (a) e dt 2T(2 1) 4 cos (2t) (Using properties of Fourier Transform to find) a) Suppose a signal m(t) is given by m()-1+sin(2 fm) where fm-10 Hz. Sketch the signal m(t) in time domain b) Find the Fourier transform M(jo) of m(t) and sketch the magnitude of M(jo) c) If m(t) is amplitude modulated with a carrier signal by x(t)-m(t)cos(27r f,1) (where fe-1000 Hz), sketch...
Please finish these questions. Thank you
Given find the Fourier transform of the following: (a) e dt 2T(2 1) 4 cos (2t) (Using properties of Fourier Transform to find) a) Suppose a signal m(t) is given by m()-1+sin(2 fm) where fm-10 Hz. Sketch the signal m(t) in time domain b) Find the Fourier transform M(jo) of m(t) and sketch the magnitude of M(jo) c) If m(t) is amplitude modulated with a carrier signal by x(t)-m(t)cos(27r f,1) (where fe-1000 Hz), sketch...
 Analysis Linear Systems
Problem 17. Consider the standard amplitude-modulation system shown in Figure 3 Figure 3 x) Channel Filter he(r) cos wor cos ωοι M(w) H(u) (a) Sketch the spectrum of r(t). (b) Sketch the spectrum of y(t) for the following cases: (i) 0S WcWo-m (iii) wc >wowm (c) Sketch the spectrum of z(t) for the following cases: (i) 0 S WcWo-m (iii) wc >wowm d) Sketch the spectrum of v(t) if we wowm and (i) w
Analysis Linear Systems
Problem 17. Consider the standard amplitude-modulation system shown in Figure 3 Figure 3 x) Channel Filter he(r) cos wor cos ωοι M(w) H(u) (a) Sketch the spectrum of r(t). (b) Sketch the spectrum of y(t) for the following cases: (i) 0S WcWo-m (iii) wc >wowm (c) Sketch the spectrum of z(t) for the following cases: (i) 0 S WcWo-m (iii) wc >wowm d) Sketch the spectrum of v(t) if we wowm and (i) w
 3. The system represented by the block diagram below modulates the message signal x(t) with a carrier wave c(t) to yield -(). The signal y(t) is generated by multiplying z() by the carrier wave c(t). c(t) c(t) y(t) z(t) The output signal,y(t), can be written as y(t)-C() × X() x C(t). Using the properties of a) Fourier Transforms, write Yi) in terms of Cjo) and Yj). [2 points] The Fourier Transform of x(t) is illustrated below. 0.9 0.8 0.7 0.6...
Most questions answered within 3 hours.
-
(63
#14)
which of the following statments best describes how chamging
the concentration of the substances...
asked 1 hour ago -
In the following reaction, which element is undergoing
oxidation: Na2SO3 + N2O --> N2 + Na2SO4...
asked 2 hours ago -
Which of the following pairs of ions have the same electron
configuration?
I: Br− and Se2−...
asked 5 hours ago -
The Foremost Composite Materials Company is planning a two-day
sales conference for October 19-20. The conference...
asked 5 hours ago -
3) Illustrate the observed pattern of relatedness of organisms
versus adaptations to specific conditions. This means...
asked 5 hours ago -
In winter a lake has a 0.35 m thick ice layer over 1.10 m of
water....
asked 6 hours ago -
Assuming the following has been encrypted with a Vigenere cipher
below, use the method(s) and assumptions...
asked 7 hours ago -
How would I use switch statements to write a program that will
take an input of...
asked 7 hours ago -
Imagine a reaction in which methane gas combusts at a constant
pressure of 1 atm and...
asked 7 hours ago -
Two parallel wires (each 12 m in length) are separated by a
distance of 0.065 m...
asked 7 hours ago -
Suppose there were three masses at the corner of uniform
equilateral triangle. The masses are m1...
asked 7 hours ago -
Situation: A building that is 618 m above the ground floor. How
many times would a...
asked 7 hours ago