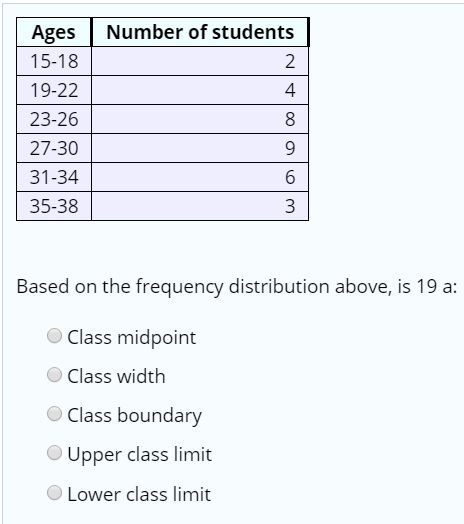
Based on the frequency distribution above, is 19 a:
Please, anyone, help me and please explain step by step the solution :D
Homework Answers
In given data, the class of ages are 15-18, 19-22, 23-26 ,27-30, 31-34, 35-38.
Where 15,19,23,27,31,35 are lower class limits
18,22,26 etc are upper class limits
The smallest number within the class limit is lower class limit
Hence in class 19-22, 19 is lower class limit.
Hence correct answer is lower class limit.
| Ages | Number of students |
|---|---|
| 15-18 | 2 |
| 19-22 | 4 |
| 23-26 | 8 |
| 27-30 | 9 |
| 31-34 | 6 |
| 35-38 | 3 |
Based on the frequency distribution above, is 4 a:
Add Answer to:
Based on the frequency distribution above, is 19 a: Please, anyone, help me and please explain...
Ages Number of students 15-18 19-22 23-26 27-30 31-34 35-38 2 4. 9 6i 3 Based...
 Ages Number of students 15-18 19-22 23-26 27-30 31-34 35-38 2 4. 9 6i 3 Based on the frequency distribution above, is 4 a: OUpper class limit Class boundary Lower class limit Class midpoint Class width
Based on the frequency distribution above, find the relative frequency for the class with lower class limit 27.
AgesNumber of students15-18919-22223-26227-30831-341035-3810Based on the frequency distribution above, find the relative frequency for the class with lower class limit 27.Relative Frequency = _______ %
Based on the frequency distribution above, find the relative frequency for the class with lower class limit 35.
AgesNumber of students15-18819-22923-26727-301031-34535-385Based on the frequency distribution above, find the relative frequency for the class with lower class limit 35. Relative Frequency = _______ Give your answer as a percent, rounded to one decimal place
Based on the frequency distribution above, find the relative frequency for the class 35-38
AgesNumber of students15-18619-221023-261027-30231-34635-384Based on the frequency distribution above, find the relative frequency for the class 35-38. Relative Frequency = _______ % Give your answer as a percent, rounded to one decimal place
Ages Number of students 15-18 5 19-22 4 23-26 5 27-30 5 31-34 8 35-38 5...
Ages Number of students 15-18 5 19-22 4 23-26 5 27-30 5 31-34 8 35-38 5 Based on the frequency distribution above, find the relative frequency for the class with lower class limit 35 Relative Frequency = % Give your answer as a percent, rounded to one decimal place
Number of students | لما Ages 15-18 19-22 23-26 27-30 31-34 35-38 اليا | دما به...
 Number of students | لما Ages 15-18 19-22 23-26 27-30 31-34 35-38 اليا | دما به 7 9 Based on the frequency distribution above, find the relative frequency for the class with lower class limit 15 Relative Frequency = % Give your answer as a percent, rounded to one decimal place Submit Question
can you please explain how you got the answers 1. Consider the following frequency table representing...
 can you please explain how you got the answers
1. Consider the following frequency table representing the distribution of hours students watch TV in a week. Week Hours Students Match Class Frequency 12- 19 20- 27 28-35 36- 43 44- 51 110 Step 1. Enter the lower class limit for the first class. Step 2. Enter the upper class limit for the second class. 19 2. Consider the following frequency table representing the distribution of cost of lunch in dollars)....
can you please explain how you got the answers
1. Consider the following frequency table representing the distribution of hours students watch TV in a week. Week Hours Students Match Class Frequency 12- 19 20- 27 28-35 36- 43 44- 51 110 Step 1. Enter the lower class limit for the first class. Step 2. Enter the upper class limit for the second class. 19 2. Consider the following frequency table representing the distribution of cost of lunch in dollars)....
Ages Number of students 15-18 10 19-22 5 23-26 9 27-30 7 31-34 6 35-38 10...
Ages Number of students 15-18 10 19-22 5 23-26 9 27-30 7 31-34 6 35-38 10 Find the relative frequency for the class with lower class limit 19 Relative Frequency = % Give your answer as a percent, rounded to two decimal places
을 ohm.lumenlearning.com Assessment Spring 2019 MA155-741 23879: HW 2 (Chapte... Lumen OHM Assessment Mathway Statistio ule...
 을 ohm.lumenlearning.com Assessment Spring 2019 MA155-741 23879: HW 2 (Chapte... Lumen OHM Assessment Mathway Statistio ule 1) Ages Number of students 15-18 19-22 23-26 27-30 31-34 35-38 7 10 10 2 Based on the frequency distribution above, find the cumulative frequency for the class with lower class limit 31 Cumulative Frequency Points possible:1 This is attempt 1 of 3. Submit
Question with last attempt is displayed for your review only Ages Number of students 15-18 19-22...
 Question with last attempt is displayed for your review only Ages Number of students 15-18 19-22 23-26 10 10 27-30 31-34 35-38 Based on the frequency distribution above, find the cumulative frequency for the class with lower clas Cumulative Frequency Give your answer rounded to one decimal place Message instructor about this question F4 FS F8 F9 5
 Ages Number of students 15-18 19-22 23-26 27-30 31-34 35-38 2 4. 9 6i 3 Based on the frequency distribution above, is 4 a: OUpper class limit Class boundary Lower class limit Class midpoint Class width
 Number of students | لما Ages 15-18 19-22 23-26 27-30 31-34 35-38 اليا | دما به 7 9 Based on the frequency distribution above, find the relative frequency for the class with lower class limit 15 Relative Frequency = % Give your answer as a percent, rounded to one decimal place Submit Question
 can you please explain how you got the answers
1. Consider the following frequency table representing the distribution of hours students watch TV in a week. Week Hours Students Match Class Frequency 12- 19 20- 27 28-35 36- 43 44- 51 110 Step 1. Enter the lower class limit for the first class. Step 2. Enter the upper class limit for the second class. 19 2. Consider the following frequency table representing the distribution of cost of lunch in dollars)....
can you please explain how you got the answers
1. Consider the following frequency table representing the distribution of hours students watch TV in a week. Week Hours Students Match Class Frequency 12- 19 20- 27 28-35 36- 43 44- 51 110 Step 1. Enter the lower class limit for the first class. Step 2. Enter the upper class limit for the second class. 19 2. Consider the following frequency table representing the distribution of cost of lunch in dollars)....
 을 ohm.lumenlearning.com Assessment Spring 2019 MA155-741 23879: HW 2 (Chapte... Lumen OHM Assessment Mathway Statistio ule 1) Ages Number of students 15-18 19-22 23-26 27-30 31-34 35-38 7 10 10 2 Based on the frequency distribution above, find the cumulative frequency for the class with lower class limit 31 Cumulative Frequency Points possible:1 This is attempt 1 of 3. Submit
 Question with last attempt is displayed for your review only Ages Number of students 15-18 19-22 23-26 10 10 27-30 31-34 35-38 Based on the frequency distribution above, find the cumulative frequency for the class with lower clas Cumulative Frequency Give your answer rounded to one decimal place Message instructor about this question F4 FS F8 F9 5
Most questions answered within 3 hours.
-
T
F 53) Most differences
between human groups are the result of biology rather than
culture....
asked 33 seconds ago -
A 5.20 mW helium neon laser emits a visible laser beam with a
wavelength of 633...
asked 3 minutes ago -
Assignment:
Your
organization has made a strategic decision
to
outsourcework
currently performed in house. You have...
asked 2 minutes ago -
A hospital performs 100 surgeries per week. The probability that
complications after surgery occur is 10%....
asked 3 minutes ago -
In preparing its cash flow statement for the year ended December
31, 2018, Green Co. gathered...
asked 4 minutes ago -
Donna is 18 years old and full time accounting student.She is
saving for an overseas holiday...
asked 5 minutes ago -
Service-oriented architectures (SOA) provide
object-oriented architectures for web platforms that represent a
collection of services. SOA...
asked 5 minutes ago -
Le Terroir Winery is considering an expansion project to produce
fine wines. The trial expansion will...
asked 14 minutes ago -
The Bahraini public budget experiences deficit in the last
seven years, what are procedures are taken...
asked 21 minutes ago -
You invested $30,000 in a mutual fund at the beginning of the
year when the NAV...
asked 25 minutes ago -
Would you expect the price elasticity of supply for guitars to
be more inelastic in the...
asked 27 minutes ago -
A snowmobile is originally at the point with position vector
30.1 m at 95.0° counterclockwise from...
asked 27 minutes ago