Assume a motion sensor is placed at the origin {i.e. position (x) = 0}. In each of the following problems, you will be given one of the following descriptions of motion: a written description, or a x versus t, a v versus t or an a versus t graph. Fill in/sketch the other threee descriptions of motion that would be consistant with the given one. Don't bother with exact numerical values, but make sure that
(a) the sign (+/-) and slope are correct
(b) the relative magnitudes of the quantities (ie, greater or less) are correct
(c) the times on the two graphs are aligned.
The first part has been completed as an example:

- x versus t graph is given, complete the description of motion, v versus t graph and a versus t graph.

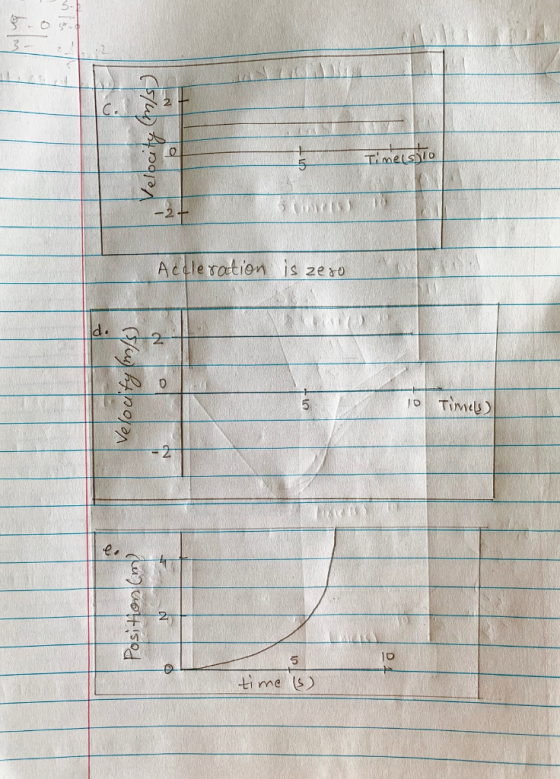
c. x versus t graph is given, complete the description of motion, v versus t graph and a versus t graph.

d. x versus t graph is given, complete the description of motion, v versus t graph and a versus t graph.

e. v versus t graph is given, complete the description of motion, x versus t graph and a versus t graph.

f. x versus t graph is given, complete the description of motion, v versus t graph and a versus t graph.

g. The description of motion is given, complete the x versus t graph, v versus t graph and a versus t graph.

h. a versus t graph is given, complete the description of motion, x versus t graph and v versus t graph.

i. v versus t graph is given, complete the description of motion, x versus t graph and a versus t graph.

x versus t graph is given, complete the description of motion, v versust graph b. and a versus t graph. (3points) Description of motion: 2 Time (s) 10 2 0 5 10 Time (s) Time (S) -2 Acceleration (m/s) 10 Velocity (m/s) 2 () uopiso
x versus t graph is given, complete the description of motion, v versus t graph and o versus t graph. (3points) C. Description of motion: 4 10 Time (s) 10 5 10 Time (s) Time (s) Acceleration (m/s) Velocity (m/s) Position (m)
x versus t graph is given, complete the description of motion, v versus t graph and a versus t graph. (3points) Description of motion: 2 5 Time (s) 10 10 10 Time (s) Time (s) Acceleration (m/s) Velocity (m/s) 2
v versus t graph is given, complete the description of motion, x versus t graph and a versus t graph. (3points) Description of motion; 10 Time (s) 10 Time (s) Time (s) Acceleration (n/s Velocity (m/s) Position (m)
f.X versus t graph is given, complete the description of motion, v versus t graph and a versus t graph. (3points) Description of motion: 0 0 5 Time (s) 10 0 5 10 Time (s) 10 Time (S) 2 Acceleration (m/s) Velocity (m/s) Position (m)
The description of motion is given, complete the x versus t graph, v versust graph and a versus t graph. (3points) Description of motion: Move toward the detector with decreasing speed, then just as you have come to rest, move away from the detector with increasing speed. 2 0 0 10 5 Time (s) 2 2 10 5 Time (s) 0 10 5 Time (s) 0 -2 Acceleration (m/s') Velocity (m/s) Position (m)
a versus t graph is given, complete the description of motion, x versus t graph and vi versus t graph. (3points) Description of motion: 10 Time (s) 0 0 10 Time (s) 0 10 Time (s) -2 Acceleration (m/s) Velocity Position (m) (S/u)
Description of motion: 2 10 Time (s) 5 0 0 0 10 0 Time (s) 10 5 Time (s) Acceleration (m/s) Velocity (m/s) Position (m) et
Homework Answers
b. Position time graph shows a straight line referring to rest; body is at rest at 2m from the sensor. Therefore velocity and acceleration will be zero.
c. describes a uniform motion started from position 2m; body is moving away from sensor at constant velocity. Acceleration is zero
d. uniform motion with initial position as 1m; body moving away from sensor at a constant speed the speed is greater than case c. Acceleration is zero
e. uniformly accelerated motion; body moving away from sensor with increasing speed,with a constant acceleration and acceleration is positive.
f. uniformly decelerated motion; body moving towards the sensor with decreasing speed , acceleration magnitude is constant and its negative.
g. the graph will be a combination of case e and case f
h. uniformly accelerated motion starting after some time or we can say the body was at rest for some time before moving away from the sensor
I. it’s a complex motion initially body moving towards sensor with constant speed then its sped increases with constant acceleration and then body goes away the sensor with constant speed
Please see the following graph


Add Answer to:
Assume a motion sensor is placed at the origin {i.e. position
(x) = 0}. In each...
use the position graph to make acceleration and velocity graph. Instructions In each of the following...
 use the position graph to make acceleration and velocity
graph.
Instructions In each of the following problems, you will be given one of the following descriptions of a motion: a written description, or an x versus t, v versus t, or a versus t graph. Predict the other three descriptions of the motion, then use the motion detector to check your answers. Check your predictions one-by-one, instead of checking several problems at once. In addition, answer the questions posed at...
use the position graph to make acceleration and velocity
graph.
Instructions In each of the following problems, you will be given one of the following descriptions of a motion: a written description, or an x versus t, v versus t, or a versus t graph. Predict the other three descriptions of the motion, then use the motion detector to check your answers. Check your predictions one-by-one, instead of checking several problems at once. In addition, answer the questions posed at...
Problem 9 For the following described motion, draw a position-time, a velocity-time, and an acceleration-time graph...
Problem 9 For the following described motion, draw a position-time, a velocity-time, and an acceleration-time graph on the grids provided: 1. Standing still at the 0.6 meter position for 1 second. 2. Walking away from the detector speeding up slowly and steadily for 2 seconds, going from rest to 1.0 m/s, at x=1.6 m. 3. Walking away from the detector steadily at 1.0 m/s for 2 seconds. 4. Coming to rest slowly and steadily over a 1 second period. 5....
In-Class Assignment 2. The figure shows a position-versus-time graph for an oscillating mass m = 0.5...
 In-Class Assignment 2. The figure shows a position-versus-time graph for an oscillating mass m = 0.5 kg. x (cm) 20 10 0 -10 -20 I(s) 4 a. Determine the period of the motion. b. Determnine the angular frecquemcy of the motion c. Determine the amplitude of the motion. d. Determine the phase constant of the motion. e. Determine the maximum speed of the mass. f. Determine the maximum acceleration of the mass. g. Determine the total energy of the system....
Instructions: You will be given one description of motion (words, motion diagram, graph of position x,...
 Instructions: You will be given one description of motion (words, motion diagram, graph of position x, velocity v, or acceleration a) and asked to complete the other descriptions of motion. For the paragraph response, select the choices from the drop-down menus that best complete the description of motion. For the position, velocity, and acceleration graphs, you will need to enter the number of the graph from the illustrated chart that best depicts the correct curve. (10) (13) (16) (19) (14)...
Three particles move along the x-axis, each starting at t0 = 0 s. The graph for...
 Three particles move along the x-axis, each starting at
t0 = 0 s. The graph for A is a position-versus-time graph;
the graph for B is a velocity-versus-time graph; the graph for C is
an acceleration-versus-time graph.
Find the velocity of the particle C at t = 6.5 s.
Particle starts with v0x = 10 m/s at t0
= 0 s. (Figure 3)
Express your answer with the appropriate units.
Next Fi ure O 3of3 a (m/s2) 30 20 10...
Three particles move along the x-axis, each starting at
t0 = 0 s. The graph for A is a position-versus-time graph;
the graph for B is a velocity-versus-time graph; the graph for C is
an acceleration-versus-time graph.
Find the velocity of the particle C at t = 6.5 s.
Particle starts with v0x = 10 m/s at t0
= 0 s. (Figure 3)
Express your answer with the appropriate units.
Next Fi ure O 3of3 a (m/s2) 30 20 10...
A particle's position on the x-axis is given by the function (3t-4t+1) m a) Make a...
 A particle's position on the x-axis is given by the function (3t-4t+1) m a) Make a position-versus time graph for the interval 0< t <5 (time is measured in seconds) b) Determine the particle's velocity at t = 2 s c) Are there any turning points in the particle's motion? If so, in what position or positions? d) Where is the particle when Vx=8 m/s? e) Draw the velocity-versus time graph for the interval 0< t <5 (time is measured...
For the following velocity graph, velocity is in m/s and time is in s. For the...
 For the following velocity graph, velocity is in m/s and time is in s. For the interval t 2s to t = 5s, find (a)[4 pts] the average acceleration, and (b)4 pts] the displacement Aæ. t 5 2 4 1 For the following described motion, draw a position-time, a velocity-time, and an acceleration-time graph on the grids provided: 1. Standing still at the 0.6 meter position for 1 second. 2. Walking away from the detector speeding up slowly and steadily...
HELP NEEDED!!!!!!! especially with the graphing for objects 1 and 2 together and object 3 squared. People are getting different graphs and I do not know if it is correct. Also SIG FIGS in analysis. TH...
 HELP NEEDED!!!!!!! especially with the graphing for objects 1
and 2 together and object 3 squared. People are getting different
graphs and I do not know if it is correct. Also SIG FIGS in
analysis. THANK YOU IN ADVANCE
Part 1 - Velocity Position versus Time (x vs t) graph for Object 1 x versust-Object 1 y 1.2754x+ 0.0187 x (m) Linear (x (m)) 0 Position versus Time (x vs t) graph for Object 2 x versus t-Object 2 4.5...
HELP NEEDED!!!!!!! especially with the graphing for objects 1
and 2 together and object 3 squared. People are getting different
graphs and I do not know if it is correct. Also SIG FIGS in
analysis. THANK YOU IN ADVANCE
Part 1 - Velocity Position versus Time (x vs t) graph for Object 1 x versust-Object 1 y 1.2754x+ 0.0187 x (m) Linear (x (m)) 0 Position versus Time (x vs t) graph for Object 2 x versus t-Object 2 4.5...
|| A particle’s position on the x-axis is given by the function x = (t 2...
|| A particle’s position on the x-axis is given by the function x = (t 2 - 4t + 2) m, where t is in s. a. Make a position-versus-time graph for the interval 0 s … t … 5 s. Do this by calculating and plotting x every 0.5 s from 0 s to 5 s, then drawing a smooth curve through the points. b. Determine the particle’s velocity at t = 1.0 s by drawing the tangent line...
Motion diagrams and video point questions Answer all questions: PHY111/21VPre Laboratory Problems: Motion Diagrams and VideoPoint...
 Motion diagrams and video point questions
Answer all questions:
PHY111/21VPre Laboratory Problems: Motion Diagrams and VideoPoint 1. Which graph best describes the "horizontal distance traveled" (vertical axis) versus elapsed" (horizontal axis) for a car traveling at a constant speed of 60 miles down the letter and then justify your answer in a complete sentence the our? Write per h Horizontal Position of Car (in miles) Answer 240 -T- 180- Justify: C,イ 日apsed Time 0 1 2 3 4 2. (a)...
Motion diagrams and video point questions
Answer all questions:
PHY111/21VPre Laboratory Problems: Motion Diagrams and VideoPoint 1. Which graph best describes the "horizontal distance traveled" (vertical axis) versus elapsed" (horizontal axis) for a car traveling at a constant speed of 60 miles down the letter and then justify your answer in a complete sentence the our? Write per h Horizontal Position of Car (in miles) Answer 240 -T- 180- Justify: C,イ 日apsed Time 0 1 2 3 4 2. (a)...
 use the position graph to make acceleration and velocity
graph.
Instructions In each of the following problems, you will be given one of the following descriptions of a motion: a written description, or an x versus t, v versus t, or a versus t graph. Predict the other three descriptions of the motion, then use the motion detector to check your answers. Check your predictions one-by-one, instead of checking several problems at once. In addition, answer the questions posed at...
use the position graph to make acceleration and velocity
graph.
Instructions In each of the following problems, you will be given one of the following descriptions of a motion: a written description, or an x versus t, v versus t, or a versus t graph. Predict the other three descriptions of the motion, then use the motion detector to check your answers. Check your predictions one-by-one, instead of checking several problems at once. In addition, answer the questions posed at...
 In-Class Assignment 2. The figure shows a position-versus-time graph for an oscillating mass m = 0.5 kg. x (cm) 20 10 0 -10 -20 I(s) 4 a. Determine the period of the motion. b. Determnine the angular frecquemcy of the motion c. Determine the amplitude of the motion. d. Determine the phase constant of the motion. e. Determine the maximum speed of the mass. f. Determine the maximum acceleration of the mass. g. Determine the total energy of the system....
 Instructions: You will be given one description of motion (words, motion diagram, graph of position x, velocity v, or acceleration a) and asked to complete the other descriptions of motion. For the paragraph response, select the choices from the drop-down menus that best complete the description of motion. For the position, velocity, and acceleration graphs, you will need to enter the number of the graph from the illustrated chart that best depicts the correct curve. (10) (13) (16) (19) (14)...
 Three particles move along the x-axis, each starting at
t0 = 0 s. The graph for A is a position-versus-time graph;
the graph for B is a velocity-versus-time graph; the graph for C is
an acceleration-versus-time graph.
Find the velocity of the particle C at t = 6.5 s.
Particle starts with v0x = 10 m/s at t0
= 0 s. (Figure 3)
Express your answer with the appropriate units.
Next Fi ure O 3of3 a (m/s2) 30 20 10...
Three particles move along the x-axis, each starting at
t0 = 0 s. The graph for A is a position-versus-time graph;
the graph for B is a velocity-versus-time graph; the graph for C is
an acceleration-versus-time graph.
Find the velocity of the particle C at t = 6.5 s.
Particle starts with v0x = 10 m/s at t0
= 0 s. (Figure 3)
Express your answer with the appropriate units.
Next Fi ure O 3of3 a (m/s2) 30 20 10...
 A particle's position on the x-axis is given by the function (3t-4t+1) m a) Make a position-versus time graph for the interval 0< t <5 (time is measured in seconds) b) Determine the particle's velocity at t = 2 s c) Are there any turning points in the particle's motion? If so, in what position or positions? d) Where is the particle when Vx=8 m/s? e) Draw the velocity-versus time graph for the interval 0< t <5 (time is measured...
 For the following velocity graph, velocity is in m/s and time is in s. For the interval t 2s to t = 5s, find (a)[4 pts] the average acceleration, and (b)4 pts] the displacement Aæ. t 5 2 4 1 For the following described motion, draw a position-time, a velocity-time, and an acceleration-time graph on the grids provided: 1. Standing still at the 0.6 meter position for 1 second. 2. Walking away from the detector speeding up slowly and steadily...
 HELP NEEDED!!!!!!! especially with the graphing for objects 1
and 2 together and object 3 squared. People are getting different
graphs and I do not know if it is correct. Also SIG FIGS in
analysis. THANK YOU IN ADVANCE
Part 1 - Velocity Position versus Time (x vs t) graph for Object 1 x versust-Object 1 y 1.2754x+ 0.0187 x (m) Linear (x (m)) 0 Position versus Time (x vs t) graph for Object 2 x versus t-Object 2 4.5...
HELP NEEDED!!!!!!! especially with the graphing for objects 1
and 2 together and object 3 squared. People are getting different
graphs and I do not know if it is correct. Also SIG FIGS in
analysis. THANK YOU IN ADVANCE
Part 1 - Velocity Position versus Time (x vs t) graph for Object 1 x versust-Object 1 y 1.2754x+ 0.0187 x (m) Linear (x (m)) 0 Position versus Time (x vs t) graph for Object 2 x versus t-Object 2 4.5...
 Motion diagrams and video point questions
Answer all questions:
PHY111/21VPre Laboratory Problems: Motion Diagrams and VideoPoint 1. Which graph best describes the "horizontal distance traveled" (vertical axis) versus elapsed" (horizontal axis) for a car traveling at a constant speed of 60 miles down the letter and then justify your answer in a complete sentence the our? Write per h Horizontal Position of Car (in miles) Answer 240 -T- 180- Justify: C,イ 日apsed Time 0 1 2 3 4 2. (a)...
Motion diagrams and video point questions
Answer all questions:
PHY111/21VPre Laboratory Problems: Motion Diagrams and VideoPoint 1. Which graph best describes the "horizontal distance traveled" (vertical axis) versus elapsed" (horizontal axis) for a car traveling at a constant speed of 60 miles down the letter and then justify your answer in a complete sentence the our? Write per h Horizontal Position of Car (in miles) Answer 240 -T- 180- Justify: C,イ 日apsed Time 0 1 2 3 4 2. (a)...
Most questions answered within 3 hours.
-
Calculate the number density of argon gas at a temperature of
24C and a pressure of...
asked 39 minutes ago -
Alternative
Classification
How to Estimate
Probabilities from Data? ( For continuous Attributes)
And How to generate...
asked 41 minutes ago -
An explosion breaks a 20.0-kg object into three parts. The
object is initially moving at a...
asked 1 hour ago -
Calculate the approximate number of residues of Rubisco, which
is involved in carbon fixation in plants,...
asked 2 hours ago -
Other decisions about scientific claims can have a much broader
impact.ENERGYarrow-10x10.png, environment, health, security - all...
asked 3 hours ago -
I need to write a research paper and work cited about this
topic: The United States...
asked 3 hours ago -
Hello! I was wondering if I could have some help?
If the vapor pressure of carvone...
asked 4 hours ago -
An economist wants to estimate the mean per capita income (in
thousands of dollars) for a...
asked 4 hours ago -
What would be the input/output characteristic of a circuit
obtained by putting two of your 2's-complementers...
asked 4 hours ago -
In Drosophila, the transition from the syncytial blastoderm
stage to the cellular blastoderm stage is a...
asked 5 hours ago -
Project management question:
Name 3 different types of resources (hint: humans are one
type)
asked 5 hours ago -
Consider the following reaction: C 2H 2( g) + 2H 2( g) C 2H 6(
g)...
asked 5 hours ago