Quality Associates, Inc., a consulting firm, advises its clients about sampling and statistical procedures that can be used to control their manufacturing processes. In one particular application, a client gave Quality Associates a sample of 800 observations taken during a time in which that client’s process was operating satisfactorily. The sample standard deviation for these data was .21; hence, with so much data, the population standard deviation was assumed to be .21. Quality Associates then suggested that random samples of size 30 be taken periodically to monitor the process on an ongoing basis. By analyzing the new samples, the client could quickly learn whether the process was operating satisfactorily. When the process was not operating satisfactorily, corrective action could be taken to eliminate the problem. The design specification indicated the mean for the process should be 12. Corrective action will be taken any time H0 is rejected.
The samples were collected at hourly intervals during the first day of operation of the new statistical process control procedure. These data are available in the Excel file named Quality.
Managerial Report
- Conduct a hypothesis test for each sample at the .01 level of significance and determine what action, if any, should be taken. Provide the test statistic and p-value for each test.
- Compute limits for the sample mean around μ = 12 such that, as long as a new sample mean is within those limits, the process will be considered to be operating satisfactorily. If exceeds the upper limit or if is below the lower limit, corrective action will be taken. These limits are referred to as upper and lower control limits for quality control purposes.
- Discuss the implications of changing the level of significance
to a larger value. What mistake or error could increase if the
level of significance is increased?

Homework Answers
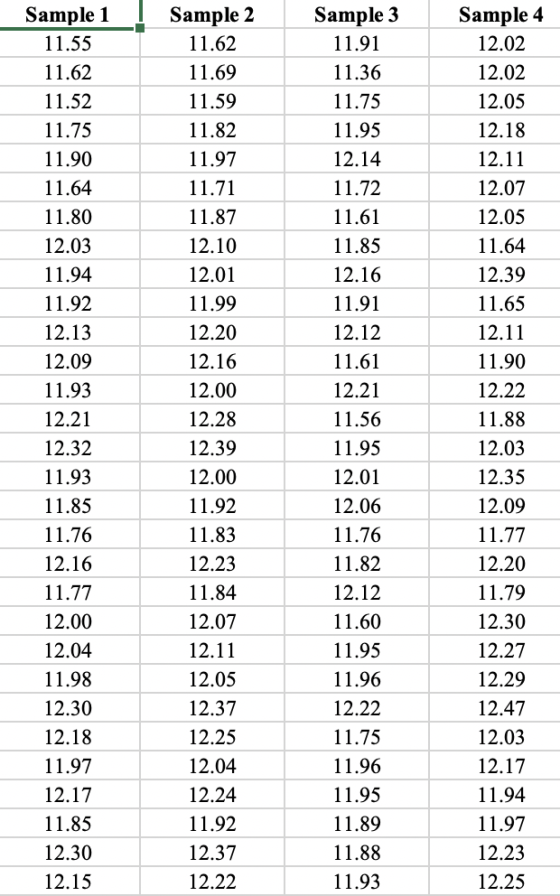
| Sample 1 | Sample 2 | Sample 3 | Sample 4 | |
| 11.55 | 11.62 | 11.91 | 12.02 | |
| 11.62 | 11.69 | 11.36 | 12.02 | |
| 11.52 | 11.59 | 11.75 | 12.05 | |
| 11.75 | 11.82 | 11.95 | 12.18 | |
| 11.9 | 11.97 | 12.14 | 12.11 | |
| 11.64 | 11.71 | 11.72 | 12.07 | |
| 11.8 | 11.87 | 11.61 | 12.05 | |
| 12.03 | 12.1 | 11.85 | 11.64 | |
| 11.94 | 12.01 | 12.16 | 12.39 | |
| 11.92 | 11.99 | 11.91 | 11.65 | |
| 12.13 | 12.2 | 12.12 | 12.11 | |
| 12.09 | 12.16 | 11.61 | 11.9 | |
| 11.93 | 12 | 12.21 | 12.22 | |
| 12.21 | 12.28 | 11.56 | 11.88 | |
| 12.32 | 12.39 | 11.95 | 12.03 | |
| 11.93 | 12 | 12.01 | 12.35 | |
| 11.85 | 11.92 | 12.06 | 12.09 | |
| 11.76 | 11.83 | 11.76 | 11.77 | |
| 12.16 | 12.23 | 11.82 | 12.2 | |
| 11.77 | 11.84 | 12.12 | 11.79 | |
| 12 | 12.07 | 11.6 | 12.3 | |
| 12.04 | 12.11 | 11.95 | 12.27 | |
| 11.98 | 12.05 | 11.96 | 12.29 | |
| 12.3 | 12.37 | 12.22 | 12.47 | |
| 12.18 | 12.25 | 11.75 | 12.03 | |
| 11.97 | 12.04 | 11.96 | 12.17 | |
| 12.17 | 12.24 | 11.95 | 11.94 | |
| 11.85 | 11.92 | 11.89 | 11.97 | |
| 12.3 | 12.37 | 11.88 | 12.23 | |
| 12.15 | 12.22 | 11.93 | 12.25 | |
| Mean | 11.95867 | 12.02867 | 11.889 | 12.08133 |
Hypothesis testing:


The first sample is within the control limits.
The confidence or control limits are given by

Only sample 3 has mean lower than the lower limit of the confidence interval.
Thus we will reject the null hypothesis for sample 3. The procedure is the same as done above. We have done the hypothesis testing for sample 3 below.
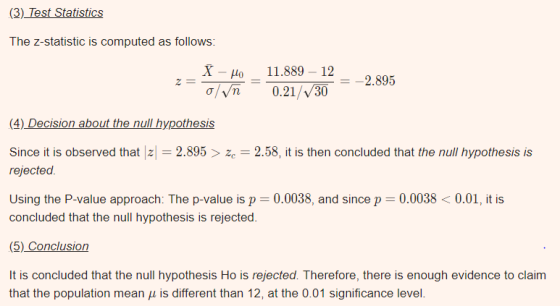
Rest of the samples are within the control limits.
Add Answer to:
Quality Associates, Inc., a consulting firm, advises its clients
about sampling and statistical procedures that can...
Case Problem 1: Quality Associates, Inc.
 Quality Associates, Inc., a consulting firm, advises its clients about sampling and statistical procedures that can be used to control their manufacturingprocesses. IN one particular application, a client game quality associates a sample of 800 observations taken during a time in which that client's process wasoperating satisfactorily. The sample standard deviation for there data was .21 ; hence, with so much data, the population standard deviation was assumed to be .21.Quality associates then suggested that random samples of size 30...
Sample 1|Sample 2 Sample 3 Sample 4 11.91 11.55 11.62 11.62 11.69 11.52 11.59 11.75 11.82 1.90 11...
 Sample 1|Sample 2 Sample 3 Sample 4 11.91 11.55 11.62 11.62 11.69 11.52 11.59 11.75 11.82 1.90 11.97 11.64 11.80 11.87 12.03 11.94 12.01 11.92 11.99 12.13 12.09 12.16 11.93 12.21 12.32 12.39 11.93 11.85 11.92 11.7611.83 11.7012.38 11.77 11 12.00 12.07 12.04 11.98 12.05 12.30 12.37 12.18 12.25 11.97 12.17 12.24 11.85 11.92 12.30 12.37 12.15 12.22 12.02 11.36 12.02 11.75 12.05 11.95 12.18 12.14 11.72 12.07 12.05 11.85 11.64 12.16 12.39 11.65 12.11 11.90 12.22 11.56 11.88 11.95...
 Quality Associates, Inc., a consulting firm, advises its clients about sampling and statistical procedures that can be used to control their manufacturingprocesses. IN one particular application, a client game quality associates a sample of 800 observations taken during a time in which that client's process wasoperating satisfactorily. The sample standard deviation for there data was .21 ; hence, with so much data, the population standard deviation was assumed to be .21.Quality associates then suggested that random samples of size 30...
 Sample 1|Sample 2 Sample 3 Sample 4 11.91 11.55 11.62 11.62 11.69 11.52 11.59 11.75 11.82 1.90 11.97 11.64 11.80 11.87 12.03 11.94 12.01 11.92 11.99 12.13 12.09 12.16 11.93 12.21 12.32 12.39 11.93 11.85 11.92 11.7611.83 11.7012.38 11.77 11 12.00 12.07 12.04 11.98 12.05 12.30 12.37 12.18 12.25 11.97 12.17 12.24 11.85 11.92 12.30 12.37 12.15 12.22 12.02 11.36 12.02 11.75 12.05 11.95 12.18 12.14 11.72 12.07 12.05 11.85 11.64 12.16 12.39 11.65 12.11 11.90 12.22 11.56 11.88 11.95...
Most questions answered within 3 hours.
-
A 10.000 g sample of water contains 11.19% H by mass. what
should be the %H...
asked 2 minutes ago -
Consider an investment game among 2 players. Each player can
either invest,
i, or not invest,-i....
asked 29 seconds ago -
The time taken to complete a particular task is normally
distributed with a standard deviation of...
asked 10 minutes ago -
we have heteroskedasticity in a regression when:
When the variance of error terms changes when an...
asked 19 minutes ago -
Explain some different types of fungi. State the different
divisions undergo by fungi.
asked 32 minutes ago -
The shortest time that 120 C can flow through a 20 A circuit
breaker without tripping...
asked 33 minutes ago -
A software design pattern is a general, reusable solution to a
commonly occurring problem, acting as...
asked 35 minutes ago -
The mean waiting time at the drive-through of a fast-food
restaurant from the time an order...
asked 52 minutes ago -
The pitch (p) of a helix is defined as p = dn, in which n is...
asked 54 minutes ago -
Do you agree that the declining stock of social capital is the
blame for the failure...
asked 58 minutes ago -
A researcher is interested in whether coffee consumption helps
with performance on reading comprehension tasks. The...
asked 1 hour ago -
it has been estimated since the beginning of the human race that
about 133 metric ton...
asked 1 hour ago