7. Short-run supply and long-run equilibrium Consider the competitive market for copper. Assume that, regardless of...
|
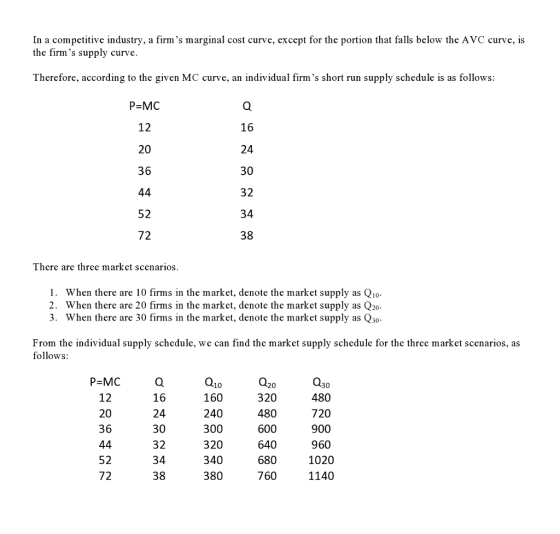
7. Short-run supply and long-run equilibrium Consider the competitive market for copper. Assume that, regardless of how many firms are in the industry, every firm in the industry is identical and faces the marginal cost (MC), average total cost (ATC), and average variable cost (AVC) curves shown on the following graph.
The following diagram shows the market demand for copper. Use the orange points (square symbol) to plot the initial short-run industry supply curve when there are 10 firms in the market. (Hint: You can disregard the portion of the supply curve that corresponds to prices where there is no output since this is the industry supply curve.) Next, use the purple points (diamond symbol) to plot the short-run industry supply curve when there are 20 firms. Finally, use the green points (triangle symbol) to plot the short-run industry supply curve when there are 30 firms.
|


Homework Answers

Add Answer to:
7. Short-run supply and long-run
equilibrium
Consider the competitive market for copper. Assume that,
regardless of...
7. Short-run supply and long-run equilibrium Consider the competitive market for copper. Assume that, regardless of...
 7. Short-run supply and long-run equilibrium Consider the competitive market for copper. Assume that, regardless of how many firms are in the industry, every firm in the industry is identical and faces the marginal cost (MC), average total cost (ATC), and average variable cost (AVC) curves shown on the following graph. COSTS (Dollars per pound) MC D AVC 0 + 0 + 10 + + + + + + + 20 30 40 50 60 70 80 QUANTITY (Thousands of...
7. Short-run supply and long-run equilibrium Consider the competitive market for copper Assume that, regardless of...
 7. Short-run supply and long-run equilibrium Consider the competitive market for copper Assume that, regardless of how manyfims are in the ndustry, every fim in the industry s dentcal and faces the marginal cost (MC), average total cost (ATC), and average variable cost (AVC) curves shown on the following graph 80 72 64 48 32 244 AVC 3 The following dagram shows the market démand for copper Use the orange points (square symbol) to plot the initial short -run industry...
6. Short-run supply and long-run equilibrium Consider the competitive market for copper. Assume that, regardless of...
 6. Short-run supply and long-run equilibrium Consider the competitive market for copper. Assume that, regardless of how many firms are in the industry, every firm in the industry is identical and faces the marginal cost (MC), average total cost (ATC), and average variable cost (AVC) curves shown on the following graph. COSTS (Dollars per pound) NON 0 3 27 30 6 12 16 18 21 24 QUANTITY (Thousands of pounds) The following diagram shows the market demand for copper The...
5. Short-run supply and long-run equilibrium Consider the competitive market for copper. Assume that, regardless of...
 5. Short-run supply and long-run equilibrium Consider the competitive market for copper. Assume that, regardless of how many firms are in the industry, every firm in the industry is identical and faces the marginal cost (MC), average total cost (ATC), and average variable cost (AVC) curves shown on the following graph. COSTS (Dollars per pound) AVC MC O 0 3 27 30 6 9 12 15 18 21 24 QUANTITY (Thousands of pounds) The following diagram shows the market demand...
8. Short-run supply and long-run equilibrium Consider the perfectly competitive market for copper. Assume that, regardless...
 8. Short-run supply and long-run equilibrium Consider the perfectly competitive market for copper. Assume that, regardless of how many firms are in the industry, every firm in the industry is identical and faces the marginal cost (MC), average total cost (ATC), and average variable cost (AVC) curves shown on the following graph. ATC COSTS (Dollars per pound) AVC MC D 0 Ft 0 3 6 9 12 15 18 21 24 27 QUANTITY OF OUTPUT (Thousands of pounds) 30 The...
5. Short-run supply and long-run equilibrium Consider the competitive market for titanium. Assume that, regardless of...
 5. Short-run supply and long-run
equilibrium
Consider the competitive market for titanium. Assume that,
regardless of how many firms are in the industry, every firm in the
industry is identical and faces the marginal cost (MC), average
total cost (ATC), and average variable cost (AVC) curves shown on
the following graph.
Consider the competitive market for titanium. Assume that, regardless of how many firms are in the industry, every firm in the industry is identical and faces the marginal cost...
5. Short-run supply and long-run
equilibrium
Consider the competitive market for titanium. Assume that,
regardless of how many firms are in the industry, every firm in the
industry is identical and faces the marginal cost (MC), average
total cost (ATC), and average variable cost (AVC) curves shown on
the following graph.
Consider the competitive market for titanium. Assume that, regardless of how many firms are in the industry, every firm in the industry is identical and faces the marginal cost...
7. Short-run supply and long-run equilibrium Consider the competitive market for titanium. Assume that, regardless of...
 7. Short-run supply and long-run equilibrium Consider the competitive market for titanium. Assume that, regardless of how many firms are in the industry, every firm in the industry is identi and faces the marginal cost (MC), average total cost (ATC), and average variable cost (AVC) curves shown on the following graph. COSTS (Dollars per pound) AVC мс о OFFFFF 0 3 6 9 12 15 18 21 24 QUANTITY (Thousands of pounds) 27 30 The following diagram shows the market...
7. Short-run supply and long-run equilibrium Consider the competitive market for steel. Assume that, regardless of...
 7. Short-run supply and long-run equilibrium Consider the competitive market for steel. Assume that, regardless of how many firms are in the industry, every firm in the industry is identical and faces the marginal cost (MC), average total cost (ATC), and average variable cost (AVC) curves shown on the following graph. BO 72 54 ATC COSTS (Dollars per ton) 40 32 24 AVC 8 МСС 3 27 30 12 15 18 21 24 QUANTITY (Thousands of tons) The following diagram...
5. Short-run supply and long-run equilibrium Consider the perfectly competitive market for steel. Assume that, regardless...
 5. Short-run supply and long-run equilibrium Consider the perfectly competitive market for steel. Assume that, regardless of how many firms are in the industry, every firm in the industry is identical and faces the marginal cost (MC), average total cost (ATC), and average variable cost (AVC) curves shown on the following graph. COSTS (Dollars per ton) + MC D AVC 0 10 90 100 20 30 40 50 60 70 80 QUANTITY (Thousands of tons) The following diagram shows the...
7. Short-run supply and long-run equilibrium Consider the competitive market for titanium. Assume that, regardless of...
 7. Short-run supply and long-run equilibrium Consider the competitive market for titanium. Assume that, regardless of how many firms are in the industry, every firm in the industry is identical and faces the marginal cost (MC), average total cost (ATC), and average variable cost (AVC) curves shown on the following graph. COSTS (Dollars per pound) + MC O AVC 0 5 45 50 10 15 20 25 30 35 40 QUANTITY (Thousands of pounds) The following diagram shows the market...
 7. Short-run supply and long-run equilibrium Consider the competitive market for copper. Assume that, regardless of how many firms are in the industry, every firm in the industry is identical and faces the marginal cost (MC), average total cost (ATC), and average variable cost (AVC) curves shown on the following graph. COSTS (Dollars per pound) MC D AVC 0 + 0 + 10 + + + + + + + 20 30 40 50 60 70 80 QUANTITY (Thousands of...
 7. Short-run supply and long-run equilibrium Consider the competitive market for copper Assume that, regardless of how manyfims are in the ndustry, every fim in the industry s dentcal and faces the marginal cost (MC), average total cost (ATC), and average variable cost (AVC) curves shown on the following graph 80 72 64 48 32 244 AVC 3 The following dagram shows the market démand for copper Use the orange points (square symbol) to plot the initial short -run industry...
 6. Short-run supply and long-run equilibrium Consider the competitive market for copper. Assume that, regardless of how many firms are in the industry, every firm in the industry is identical and faces the marginal cost (MC), average total cost (ATC), and average variable cost (AVC) curves shown on the following graph. COSTS (Dollars per pound) NON 0 3 27 30 6 12 16 18 21 24 QUANTITY (Thousands of pounds) The following diagram shows the market demand for copper The...
 5. Short-run supply and long-run equilibrium Consider the competitive market for copper. Assume that, regardless of how many firms are in the industry, every firm in the industry is identical and faces the marginal cost (MC), average total cost (ATC), and average variable cost (AVC) curves shown on the following graph. COSTS (Dollars per pound) AVC MC O 0 3 27 30 6 9 12 15 18 21 24 QUANTITY (Thousands of pounds) The following diagram shows the market demand...
 8. Short-run supply and long-run equilibrium Consider the perfectly competitive market for copper. Assume that, regardless of how many firms are in the industry, every firm in the industry is identical and faces the marginal cost (MC), average total cost (ATC), and average variable cost (AVC) curves shown on the following graph. ATC COSTS (Dollars per pound) AVC MC D 0 Ft 0 3 6 9 12 15 18 21 24 27 QUANTITY OF OUTPUT (Thousands of pounds) 30 The...
 5. Short-run supply and long-run
equilibrium
Consider the competitive market for titanium. Assume that,
regardless of how many firms are in the industry, every firm in the
industry is identical and faces the marginal cost (MC), average
total cost (ATC), and average variable cost (AVC) curves shown on
the following graph.
Consider the competitive market for titanium. Assume that, regardless of how many firms are in the industry, every firm in the industry is identical and faces the marginal cost...
5. Short-run supply and long-run
equilibrium
Consider the competitive market for titanium. Assume that,
regardless of how many firms are in the industry, every firm in the
industry is identical and faces the marginal cost (MC), average
total cost (ATC), and average variable cost (AVC) curves shown on
the following graph.
Consider the competitive market for titanium. Assume that, regardless of how many firms are in the industry, every firm in the industry is identical and faces the marginal cost...
 7. Short-run supply and long-run equilibrium Consider the competitive market for titanium. Assume that, regardless of how many firms are in the industry, every firm in the industry is identi and faces the marginal cost (MC), average total cost (ATC), and average variable cost (AVC) curves shown on the following graph. COSTS (Dollars per pound) AVC мс о OFFFFF 0 3 6 9 12 15 18 21 24 QUANTITY (Thousands of pounds) 27 30 The following diagram shows the market...
 7. Short-run supply and long-run equilibrium Consider the competitive market for steel. Assume that, regardless of how many firms are in the industry, every firm in the industry is identical and faces the marginal cost (MC), average total cost (ATC), and average variable cost (AVC) curves shown on the following graph. BO 72 54 ATC COSTS (Dollars per ton) 40 32 24 AVC 8 МСС 3 27 30 12 15 18 21 24 QUANTITY (Thousands of tons) The following diagram...
 5. Short-run supply and long-run equilibrium Consider the perfectly competitive market for steel. Assume that, regardless of how many firms are in the industry, every firm in the industry is identical and faces the marginal cost (MC), average total cost (ATC), and average variable cost (AVC) curves shown on the following graph. COSTS (Dollars per ton) + MC D AVC 0 10 90 100 20 30 40 50 60 70 80 QUANTITY (Thousands of tons) The following diagram shows the...
 7. Short-run supply and long-run equilibrium Consider the competitive market for titanium. Assume that, regardless of how many firms are in the industry, every firm in the industry is identical and faces the marginal cost (MC), average total cost (ATC), and average variable cost (AVC) curves shown on the following graph. COSTS (Dollars per pound) + MC O AVC 0 5 45 50 10 15 20 25 30 35 40 QUANTITY (Thousands of pounds) The following diagram shows the market...
Most questions answered within 3 hours.
-
Given the reaction where 1.00 mol H2(g) is burned in excess
O2(g) at 25 °C,
H2(g)...
asked 2 minutes ago -
Suppose you wanted to make a buffer with pH 3.00. What chemicals
would you grab off...
asked 8 minutes ago -
Many celebrities and public figures have Twitter accounts with
large numbers of followers. However, some of...
asked 10 minutes ago -
Elemental phosphorus is produced by the reaction, 2Ca3(PO4)2
+6SiO2 +10C→6CaSiO3 +10CO+P4 Suppose that you have 7.00...
asked 9 minutes ago -
A nationwide survey found that 64% of people in the
Kingdom like Berger. If 3 people...
asked 22 minutes ago -
CYTOGENETIC MAPS VS LINKAGE MAPS
how do you read and extract information from cytogenetic and
linkage...
asked 23 minutes ago -
What volume of a 0.251 M perchloric
acid solution is required to neutralize
14.6 mL of...
asked 23 minutes ago -
Amplitude=3;
fs=8000;
n=0:399;
t=0:1/fs: n*1/fs-1/fs;
signal=3+3*cos(2*pi*1100*t)+3*cos(2*pi*2200*t)+3*cos(2*pi*3300*t);
fftSignal= fft(signal);
fftSignal=f ftshift (fftSignal);
f=fs/2*linspace(-1,1,fs);
plot(f,abs(fftsignal);
xlabel('Frequency(Hz)’)
yla
asked 24 minutes ago -
Write a method called removeDuplicates that
accepts a PriorityQueue of integers as a parameter
and modifies...
asked 26 minutes ago -
What is the wavelength, in cm, of a microwave having a frequency
of 3.44 x 10^9...
asked 44 minutes ago -
A new business venture must develop a comprehensive business
plan to borrow money to get started....
asked 46 minutes ago -
Madtack Company uses a job-order costing system and started the month
of March with only one...
asked 48 minutes ago