

Homework Answers
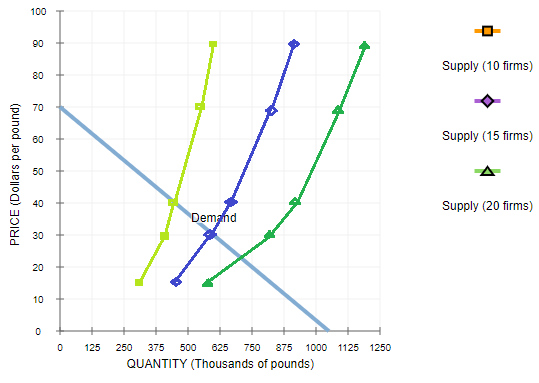
| P | QS-1 FIRM | QS-10 FIRMS | QS-15 FIRMS | QS-20 FIRMS |
| 10 | 0 | 0 | 0 | 0 |
| 15 | 30000 | 300000 | 450000 | 600000 |
| 30 | 40000 | 400000 | 600000 | 800000 |
| 40 | 45000 | 450000 | 675000 | 900000 |
| 70 | 55000 | 550000 | 825000 | 1100000 |
| 90 | 60000 | 600000 | 900000 | 1200000 |
Blanks-
1) 40
2) earn positive profits
3) enter
4) zero
5) 30
6) 15
The statement is False
Add Answer to:
7. Short-run supply and long-run equilibrium Consider the competitive market for copper. Assume that, regardless of...
5. Short-run supply and long-run equilibrium Consider the competitive market for copper. Assume that, regardless of...
 5. Short-run supply and long-run equilibrium Consider the competitive market for copper. Assume that, regardless of how many firms are in the industry, every firm in the industry is identical and faces the marginal cost (MC), average total cost (ATC), and average variable cost (AVC) curves shown on the following graph. COSTS (Dollars per pound) AVC MC O 0 3 27 30 6 9 12 15 18 21 24 QUANTITY (Thousands of pounds) The following diagram shows the market demand...
6. Short-run supply and long-run equilibrium Consider the competitive market for copper. Assume that, regardless of...
 6. Short-run supply and long-run equilibrium Consider the competitive market for copper. Assume that, regardless of how many firms are in the industry, every firm in the industry is identical and faces the marginal cost (MC), average total cost (ATC), and average variable cost (AVC) curves shown on the following graph. COSTS (Dollars per pound) NON 0 3 27 30 6 12 16 18 21 24 QUANTITY (Thousands of pounds) The following diagram shows the market demand for copper The...
8. Short-run supply and long-run equilibrium Consider the perfectly competitive market for copper. Assume that, regardless...
 8. Short-run supply and long-run equilibrium Consider the perfectly competitive market for copper. Assume that, regardless of how many firms are in the industry, every firm in the industry is identical and faces the marginal cost (MC), average total cost (ATC), and average variable cost (AVC) curves shown on the following graph. ATC COSTS (Dollars per pound) AVC MC D 0 Ft 0 3 6 9 12 15 18 21 24 27 QUANTITY OF OUTPUT (Thousands of pounds) 30 The...
7. Short-run supply and long-run equilibrium Consider the competitive market for copper Assume that, regardless of...
 7. Short-run supply and long-run equilibrium Consider the competitive market for copper Assume that, regardless of how manyfims are in the ndustry, every fim in the industry s dentcal and faces the marginal cost (MC), average total cost (ATC), and average variable cost (AVC) curves shown on the following graph 80 72 64 48 32 244 AVC 3 The following dagram shows the market démand for copper Use the orange points (square symbol) to plot the initial short -run industry...
7. Short-run supply and long-run equilibrium Consider the competitive market for titanium. Assume that, regardless of...
 7. Short-run supply and long-run equilibrium Consider the competitive market for titanium. Assume that, regardless of how many firms are in the industry, every firm in the industry is identical and faces the marginal cost (MC), average total cost (ATC), and average variable cost (AVC) curves shown on the following graph. COSTS (Dollars per pound) + MC O AVC 0 5 45 50 10 15 20 25 30 35 40 QUANTITY (Thousands of pounds) The following diagram shows the market...
7. Short-run supply and long-run equilibrium Consider the competitive market for titanium. Assume that, regardless of...
 7. Short-run supply and long-run equilibrium Consider the competitive market for titanium. Assume that, regardless of how many firms are in the industry, every firm in the industry is identi and faces the marginal cost (MC), average total cost (ATC), and average variable cost (AVC) curves shown on the following graph. COSTS (Dollars per pound) AVC мс о OFFFFF 0 3 6 9 12 15 18 21 24 QUANTITY (Thousands of pounds) 27 30 The following diagram shows the market...
5. Short-run supply and long-run equilibrium Consider the competitive market for titanium. Assume that, regardless of...
 5. Short-run supply and long-run
equilibrium
Consider the competitive market for titanium. Assume that,
regardless of how many firms are in the industry, every firm in the
industry is identical and faces the marginal cost (MC), average
total cost (ATC), and average variable cost (AVC) curves shown on
the following graph.
Consider the competitive market for titanium. Assume that, regardless of how many firms are in the industry, every firm in the industry is identical and faces the marginal cost...
5. Short-run supply and long-run
equilibrium
Consider the competitive market for titanium. Assume that,
regardless of how many firms are in the industry, every firm in the
industry is identical and faces the marginal cost (MC), average
total cost (ATC), and average variable cost (AVC) curves shown on
the following graph.
Consider the competitive market for titanium. Assume that, regardless of how many firms are in the industry, every firm in the industry is identical and faces the marginal cost...
5. Short-run supply and long-run equilibrium Consider the competitive market for titanium. Assume that, regardless of...
 5. Short-run supply and long-run equilibrium Consider the competitive market for titanium. Assume that, regardless of how many firms are in the industry, every firm in the industry is identical and faces the marginal cost (MC), average total cost (ATC), and average variable cost (AVC) curves shown on the following graph. 16, 52 COSTS (Dollars per pound) AVC + D + 0 + 3 MC D + + + + + + + 6 9 12 15 18 21 24...
7. Short-run supply and long-run equilibrium Consider the competitive market for titanium. Assume that, regardless of...
 7. Short-run supply and long-run equilibrium Consider the competitive market for titanium. Assume that, regardless of how many firms are in the industry, every firm in the industry is identical and faces the marginal cost (MC), average total cost (ATC), and average variable cost (AVC) curves shown on the following graph. 100 90 80 70 80 50 40 30 30, 15 20 AVC 10 102030405060 708090100 QUANTITY (Thousands of pounds) The following diagram shows the market demand for titanium Use...
7. Short-run supply and long-run equilibrium Consider the competitive market for titanium. Assume that, regardless of...
 7. Short-run supply and long-run equilibrium Consider the competitive market for titanium. Assume that, regardless of how many firms are in the industry, every firm in the industry is identical and faces the marginal cost (MC), average total cost (ATC), and average variable cost (AVC) curves shown on the following graph. 100 T 90 - 80 60 50 40 30 20 0 5 10 15 20 25 30 35 4045 50 QUANTITY (Thousands of pounds) The following diagram shows the...
 5. Short-run supply and long-run equilibrium Consider the competitive market for copper. Assume that, regardless of how many firms are in the industry, every firm in the industry is identical and faces the marginal cost (MC), average total cost (ATC), and average variable cost (AVC) curves shown on the following graph. COSTS (Dollars per pound) AVC MC O 0 3 27 30 6 9 12 15 18 21 24 QUANTITY (Thousands of pounds) The following diagram shows the market demand...
 6. Short-run supply and long-run equilibrium Consider the competitive market for copper. Assume that, regardless of how many firms are in the industry, every firm in the industry is identical and faces the marginal cost (MC), average total cost (ATC), and average variable cost (AVC) curves shown on the following graph. COSTS (Dollars per pound) NON 0 3 27 30 6 12 16 18 21 24 QUANTITY (Thousands of pounds) The following diagram shows the market demand for copper The...
 8. Short-run supply and long-run equilibrium Consider the perfectly competitive market for copper. Assume that, regardless of how many firms are in the industry, every firm in the industry is identical and faces the marginal cost (MC), average total cost (ATC), and average variable cost (AVC) curves shown on the following graph. ATC COSTS (Dollars per pound) AVC MC D 0 Ft 0 3 6 9 12 15 18 21 24 27 QUANTITY OF OUTPUT (Thousands of pounds) 30 The...
 7. Short-run supply and long-run equilibrium Consider the competitive market for copper Assume that, regardless of how manyfims are in the ndustry, every fim in the industry s dentcal and faces the marginal cost (MC), average total cost (ATC), and average variable cost (AVC) curves shown on the following graph 80 72 64 48 32 244 AVC 3 The following dagram shows the market démand for copper Use the orange points (square symbol) to plot the initial short -run industry...
 7. Short-run supply and long-run equilibrium Consider the competitive market for titanium. Assume that, regardless of how many firms are in the industry, every firm in the industry is identical and faces the marginal cost (MC), average total cost (ATC), and average variable cost (AVC) curves shown on the following graph. COSTS (Dollars per pound) + MC O AVC 0 5 45 50 10 15 20 25 30 35 40 QUANTITY (Thousands of pounds) The following diagram shows the market...
 7. Short-run supply and long-run equilibrium Consider the competitive market for titanium. Assume that, regardless of how many firms are in the industry, every firm in the industry is identi and faces the marginal cost (MC), average total cost (ATC), and average variable cost (AVC) curves shown on the following graph. COSTS (Dollars per pound) AVC мс о OFFFFF 0 3 6 9 12 15 18 21 24 QUANTITY (Thousands of pounds) 27 30 The following diagram shows the market...
 5. Short-run supply and long-run
equilibrium
Consider the competitive market for titanium. Assume that,
regardless of how many firms are in the industry, every firm in the
industry is identical and faces the marginal cost (MC), average
total cost (ATC), and average variable cost (AVC) curves shown on
the following graph.
Consider the competitive market for titanium. Assume that, regardless of how many firms are in the industry, every firm in the industry is identical and faces the marginal cost...
5. Short-run supply and long-run
equilibrium
Consider the competitive market for titanium. Assume that,
regardless of how many firms are in the industry, every firm in the
industry is identical and faces the marginal cost (MC), average
total cost (ATC), and average variable cost (AVC) curves shown on
the following graph.
Consider the competitive market for titanium. Assume that, regardless of how many firms are in the industry, every firm in the industry is identical and faces the marginal cost...
 5. Short-run supply and long-run equilibrium Consider the competitive market for titanium. Assume that, regardless of how many firms are in the industry, every firm in the industry is identical and faces the marginal cost (MC), average total cost (ATC), and average variable cost (AVC) curves shown on the following graph. 16, 52 COSTS (Dollars per pound) AVC + D + 0 + 3 MC D + + + + + + + 6 9 12 15 18 21 24...
 7. Short-run supply and long-run equilibrium Consider the competitive market for titanium. Assume that, regardless of how many firms are in the industry, every firm in the industry is identical and faces the marginal cost (MC), average total cost (ATC), and average variable cost (AVC) curves shown on the following graph. 100 90 80 70 80 50 40 30 30, 15 20 AVC 10 102030405060 708090100 QUANTITY (Thousands of pounds) The following diagram shows the market demand for titanium Use...
 7. Short-run supply and long-run equilibrium Consider the competitive market for titanium. Assume that, regardless of how many firms are in the industry, every firm in the industry is identical and faces the marginal cost (MC), average total cost (ATC), and average variable cost (AVC) curves shown on the following graph. 100 T 90 - 80 60 50 40 30 20 0 5 10 15 20 25 30 35 4045 50 QUANTITY (Thousands of pounds) The following diagram shows the...
Most questions answered within 3 hours.
-
In preparing its bank reconciliation for the month of April
2018, Haskins, Inc. has available the...
asked 8 minutes ago -
Your job is to do the following: build a Monster class as your
base class, along...
asked 10 minutes ago -
Phosgene (COCl2) reacts with ammonia
(NH3), as shown in this reaction. If 1.2 grams of
COCl2...
asked 17 minutes ago -
Wefald Company sold bonds with a face value of $675,000 for
$625,000. The bonds have a...
asked 26 minutes ago -
Research predefined java packages. Select 2 packages and
describe what they provide. Explain briefly what type...
asked 43 minutes ago -
A fair 9-sided die is tossed. Find P(4
or at least 5). That is, find the...
asked 52 minutes ago -
Part of an ANOVA table is shown below.
Source of
Variation
Sum of
Squares
Degrees
of...
asked 1 hour ago -
The activation energy for the decomposition of N2O4 is 57.2.
kJ/mol. If the rate constant for...
asked 1 hour ago -
The structure and function of a neuron
Ion channels, ion flow, and membrane potential changes...
asked 1 hour ago -
Calculate the pH of a 0.982 M solution of hydrogen sulfide (H2S)
Where: H2S (aq) ->...
asked 1 hour ago -
The table shows population statistics for the ages of Best Actor
and Best Supporting Actor winners...
asked 1 hour ago -
In the following table the activities with their precedence
sequence and expected time (days) are listed...
asked 1 hour ago