
TABLE 21.1 JetBlue Option Quotes JBLU 5.03 +0.11 Vol 7335887 Jul 24 2009 @ 17:17 ET Bid 5.03 Ask 5.04 Size 168 96 Open Open Calls Bid Ask Vol Puts Bid Ask Vol Int Int 09 Dec 5.00 (JGQ LA) 09 Dec 5.00 (JGQ XA) 0.80 0.90 47 5865 0.80 0.90 6 1000 09 Dec 6.00 (JGQ LF) 0.45 09 Dec 6.00 (JGQ XF) 1.40 2 0 0.55 259 1.50 84 10 Jan 5.00 (JGQ AA 0.85 1.00 125 10 Jan 5.00 (JGQ MA 0.85 6433 0.95 10 14737 10 Jan 6.00 JGQ AF) 0.50 10 Jan 6.00 (JGQ MF) 1.45 22 0.60 28 1.55 10 Jan 9.00 (JGQ A) 0.05 0.15 818 10 Jan 9.00 (JGQ MI) 4.00 0 0 4.10 10 Mar 5.00 (JGQ CA 10 Mar 5.00 (JGQ OA) 1.05 1.15 50 1.00 1.10 0 40 10 Mar 6.00 (JGQ OF 10 Mar 6.00 (JGQ CF) 0.65 0 146 1.60 1.70 0.75 10 41 0.50 10 Mar 7.00 (JGQ CG) 10 Mar 700 (JGQ OG) 0.40 3 2.30 2.45 10 0 Source: Chicago Board Options Exchange at www.cboe.com
Homework Answers
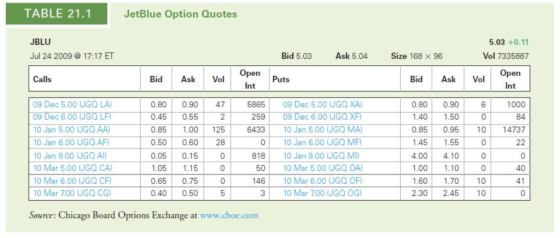
Here number of days = 188 days
strike X = 9
spot S = 5.03
Risk-free rate = 2.31
δ=N(d1)

After calculation,
we found delta of the call to be 
Beta of stock 
Beta of call = (S/X) *Δ *β = ( 5.03 /9)*0.159*0.86 = 0.075
| K | Option strike price |
| N | A standard normal cumulative distribution function |
| r | Risk-free interest rate |
| σ | The volatility of the underlying |
| S | Price of the underlying |
| t | Time to option's expiry |
Options leverage ratio : ( delta of call * stock price - option price ) / option price , option price = 0.15 ; so
Options leverage is 4.332
Add Answer to:
Calculate the beta of the January 2010 $9 call option (maturing on January 15, 2010) on...
Please show your work. Thank you. Question(s): Please answer first question first. 1. Calculate Beta 2....
Please show your work. Thank you. Question(s): Please answer first question first. 1. Calculate Beta 2. Run a regression analysis using one set of returns as dependent or outcome (Y) and the other as independent or (X). Option Time of last trade Exp Date PrevClose Open Bid Ask Strike Vol Open Int IV 1 7-Jan-19 ITM_P AAPL190118P00160000 2019-01-07 3:57PM EST 1/18/19 12.33 11.85 12.10 12.65 160.00 848 35,209 37.96% 2 8-Jan-19 ITM_P AAPL190118P00160000 2019-01-07 3:57PM EST 1/18/19 12.33 10.90 9.50...
Using data from the Southwest case, create a chart that plots the relationship between each airline’s...
 Using data from the Southwest case, create a chart that plots
the relationship between each airline’s market share, in terms of
revenue or airline seat miles flown, and its profitability for two
periods: 1995-2000 and 2001-2005. Does your analysis suggest that
market share is correlated with profitability in this industry? If
you exclude Southwest Airlines and Jet Blue airlines from the
analysis (companies that use “point-to-point” route structure
rather than a “hub and spoke” route structure), how well does
market...
Using data from the Southwest case, create a chart that plots
the relationship between each airline’s market share, in terms of
revenue or airline seat miles flown, and its profitability for two
periods: 1995-2000 and 2001-2005. Does your analysis suggest that
market share is correlated with profitability in this industry? If
you exclude Southwest Airlines and Jet Blue airlines from the
analysis (companies that use “point-to-point” route structure
rather than a “hub and spoke” route structure), how well does
market...
Most questions answered within 3 hours.
-
Calculate the pH of each of the following solutions.
0.50 M HBr
3.1×10⁻⁴ M KOH
4.2×10⁻⁵...
asked 3 hours ago -
For the year ended December 31, Depot Max’s cost of merchandise
sold was $85,600. Inventory at the...
asked 3 hours ago -
Week 10 - Professional Memo Assignment
Professional Memo Assignment
Your mission for this week, should you...
asked 3 hours ago -
Write a Python program that stores the data for each
player on the team, and it...
asked 3 hours ago -
In
the last 3 months, mike never knows when he is going to get his
allowance...
asked 4 hours ago -
Is Ca(OH)2 a Bronsted base, Lewis base, or both? Why?
asked 3 hours ago -
1A- Why don’t voters complain about U.S. tariffs on imported
sugar?
Because sugar is only a...
asked 4 hours ago -
Cash Payback Period
Primera Banco is evaluating two capital investment proposals for
a drive-up ATM kiosk,...
asked 4 hours ago -
Create a button in Swift (Xcode) that will create a charge,
create a charge using Stripe's...
asked 4 hours ago -
The reaction rate of CO and NO2 in the reaction
CO(g) + NO2(g) → CO2(g) +...
asked 4 hours ago -
Imagine that a chemist puts 6.40 mol each of
C3H8 and O2 in a 1.00-L container...
asked 4 hours ago -
How much money should be invested today in order to have $8340
at the end of...
asked 4 hours ago