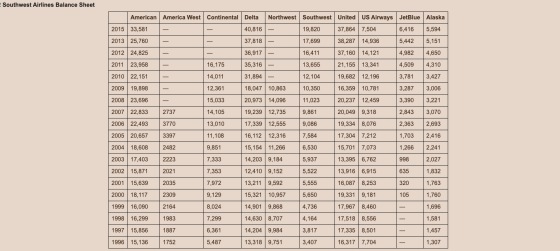
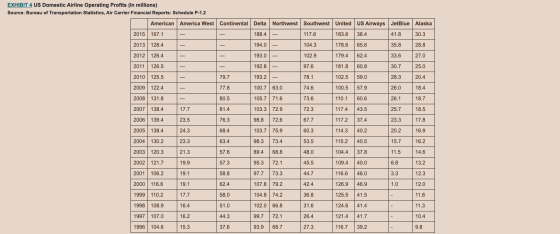
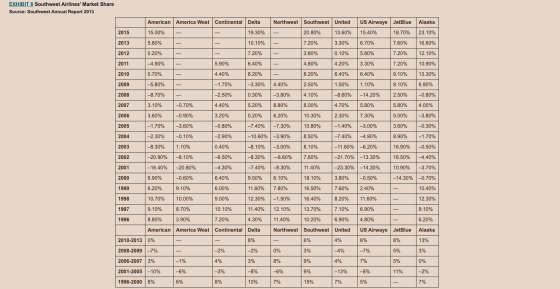
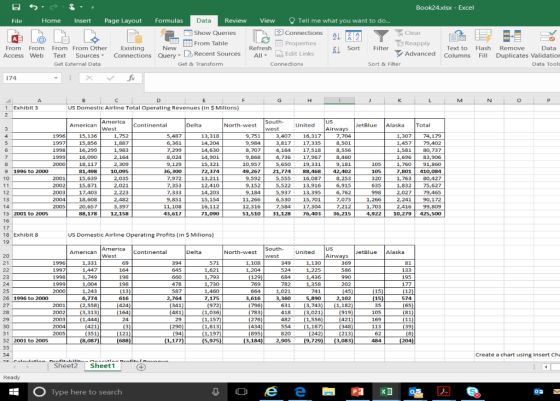
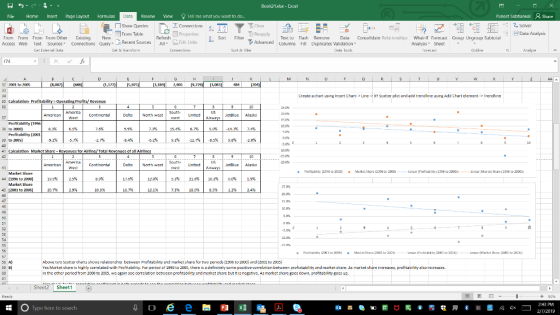
Using data from the Southwest case, create a chart that plots the relationship between each airline’s market share, in terms of revenue or airline seat miles flown, and its profitability for two periods: 1995-2000 and 2001-2005. Does your analysis suggest that market share is correlated with profitability in this industry? If you exclude Southwest Airlines and Jet Blue airlines from the analysis (companies that use “point-to-point” route structure rather than a “hub and spoke” route structure), how well does market share predict profitability?


Homework Answers
:: Solution ::


Add Answer to:
Using data from the Southwest case, create a chart that plots
the relationship between each airline’s...
Suppose an article included the accompanying data on airline quality score and a ranking based on...
Suppose an article included the accompanying data on airline quality score and a ranking based on the number of passenger complaints per 100,000 passengers boarded. In the complaint ranking, a rank of 1 is best, corresponding to fewest complaints. Similarly, for the quality score, lower scores correspond to higher quality. Airline Passenger Complaint Rank Airline Quality Score Airtran 6 4 Alaska 2 3 American 8 7 Continental 7 5 Delta 12 8 Frontier 5 6 Hawaiian 3 Not rated JetBlue...
Case study 7.2: The airline industry has very marked differences in structure between the United States...
Case study 7.2: The airline industry has very marked differences in structure between the United States and Europe. US airlines were deregulated in 1978, leading to intense competition on many routes, bankruptcies and mergers. In Europe the airlines have remained highly regulated, with governments protecting their own largely state-owned airlines. The deregulation in the US has led to much lower fares per passenger-mile and has caused some radical changes in structuring and therefore unit costs. Economies of scale arise if...
According to an In The News article titled "Rivals Match Southwest's Flash Sale, Multiple Choice American...
 According to an In The News article titled "Rivals Match Southwest's Flash Sale, Multiple Choice American Airlines, Continental Airlines, and United Airlines matched Southwest's fare cuts, but US Airways, JetBlue Airways, and Delta Air Lines did not Airlines will match their rivals' fares but are often slow to react because the frms prefer to sell at the higher price. Airlines often match their rivals' fares rather than risk losing price-sensitive passengers Rival airlines put pressure on Southwest to retreat back...
On-time arrivals, lost baggage, and customer complaints are three measures that are typically used to measure...
On-time arrivals, lost baggage, and customer complaints are three measures that are typically used to measure the quality of service being offered by airlines. Suppose that the following values represent the on-time arrival percentage, amount of lost baggage, and customer complaints for 10 U.S. airlines. Airline On-Time Arrivals (%) Mishandled Baggage per 1,000 Passengers Customer Complaints per 1,000 Passengers Virgin America 83.5 0.87 1.50 JetBlue 79.1 1.88 0.79 AirTran Airways 87.1 1.58 0.91 Delta Air Lines 86.5 2.10 0.73 Alaska...
Consider the following data for the airline industry for July 2018 (EV=enterprise value, Book=equity book value)....
Consider the following data for the airline industry for July 2018 (EV=enterprise value, Book=equity book value). Suppose Alaska Air (ALK) has 123123 million shares outstanding. Estimate Alaska Air's share value using each of the five valuation multiples, based on the median valuation multiple of the other seven airlines shown. Market Capitalization Enterprise Value (EV) EV/Sales EV/EBITDA EV/EBIT P/E Forward P/E Total Shares Alaska Air (ALK) 7,286 8,207 1.02 5.1 6.7 7.7 12.5 123 Peer Data American Airlines (AAL) 17,879 37,327...
Table 1 Consider the following data for the airline industry in early 2018 (EV = enterprise...
Table 1 Consider the following data for the airline industry in early 2018 (EV = enterprise value, BV = book value,NM = not meaningful because divisor is negative). P/E price-earnings ratio, P/S price-to sales, P/B price to book balue Table 2 December 28,2018 December 31,2017 Company Name Market Cap EV P/E (T) P/E (F) PEG P/S P/B EV/Sales EV/EBITDA EBIT EV/EBIT EBITDA Equity Delta Air Lines (DAL) 33.61 43.46 9.69 7.35 0.54 0.76 2.96 0.99 0.6 $5,855,000 7.423 Price EPS...
I would like an executive summary on this case study. Thank you! 73 CHAPTER 2 Fatalie...
 I
would like an executive summary on this case study.
Thank you!
73 CHAPTER 2 Fatalie The Identification of Opportunities and Theats Fiect the fer any re sich im es Closing Case Plane Wreck: The Airline Industry in 2001-2004 Between 2001 and 2003 players in the global line indos iets at the gate. As a result of such flexible work rules, try lost some $30 billion, more money than the industry Southwest needs only 80 employees to support and fly...
I
would like an executive summary on this case study.
Thank you!
73 CHAPTER 2 Fatalie The Identification of Opportunities and Theats Fiect the fer any re sich im es Closing Case Plane Wreck: The Airline Industry in 2001-2004 Between 2001 and 2003 players in the global line indos iets at the gate. As a result of such flexible work rules, try lost some $30 billion, more money than the industry Southwest needs only 80 employees to support and fly...
A line chart of these data would provide what type of illustration of US stock values?...
A line chart of these data would provide what type of illustration of US stock values? New Stock Issued Trading Volume of Existing Stock 1990 $23.90 $1,750.00 1991 $75.90 $2,175.00 1992 $101.80 $2,600.00 1993 $130.80 $3,575.00 1994 $76.90 $3,875.00 1995 $97.10 $5,425.00 1996 $151.90 $7,250.00 1997 $153.40 $10,125.00 1998 $152.70 $12,975.00 1999 $191.70 $19,800.00 2000 $204.50 $31,200.00 2001 $169.70 $21,600.00 2002 $154.00 $17,425.00 2003 $156.30 $16,625.00 2004 $202.70 $20,175.00 2005 $190.40 $23,900.00 2006 $190.50 $28,700.00 2007 $247.50 $36,700.00 2008 $242.61...
Consider the following data for the airline industry for December 2015 (EV=enterprise value, Book=equity book value)...
Consider the following data for the airline industry for December 2015 (EV=enterprise value, Book=equity book value) Suppose Hawaiian Airlines (HA) has 52.9 million shares outstanding. Estimate Hawaiian’s share value using each of the five valuation multiples in Table, based on the median valuation multiple of the other seven airlines shown. Market Capitalization Enterprise Value (EV) EV/Sales EV/EBITDA EV/EBIT P/E P/Book Delta Air Lines (DAL) 40857 45846 1.1x 6.0x 7.6x 15.0x 4.0x American Airlines (AAL) 27249...
 According to an In The News article titled "Rivals Match Southwest's Flash Sale, Multiple Choice American Airlines, Continental Airlines, and United Airlines matched Southwest's fare cuts, but US Airways, JetBlue Airways, and Delta Air Lines did not Airlines will match their rivals' fares but are often slow to react because the frms prefer to sell at the higher price. Airlines often match their rivals' fares rather than risk losing price-sensitive passengers Rival airlines put pressure on Southwest to retreat back...
 I
would like an executive summary on this case study.
Thank you!
73 CHAPTER 2 Fatalie The Identification of Opportunities and Theats Fiect the fer any re sich im es Closing Case Plane Wreck: The Airline Industry in 2001-2004 Between 2001 and 2003 players in the global line indos iets at the gate. As a result of such flexible work rules, try lost some $30 billion, more money than the industry Southwest needs only 80 employees to support and fly...
I
would like an executive summary on this case study.
Thank you!
73 CHAPTER 2 Fatalie The Identification of Opportunities and Theats Fiect the fer any re sich im es Closing Case Plane Wreck: The Airline Industry in 2001-2004 Between 2001 and 2003 players in the global line indos iets at the gate. As a result of such flexible work rules, try lost some $30 billion, more money than the industry Southwest needs only 80 employees to support and fly...
Most questions answered within 3 hours.
-
In a multiple regression analysis, two independent variables are
considered, and the sample size is 26....
asked 2 hours ago -
FOR JAVA:
Summary: Write a program to assess password stringency.
The solution should be named Password.java....
asked 2 hours ago -
2. (1.5pt) Calculate [ClO-] in a 6.00% bleach solution. A 6.00%
bleach solution contains 6.00g of...
asked 3 hours ago -
Protons in cosmic rays have been observed with kinetic energies
as large as 1.0×10²⁰eV.
How fast...
asked 4 hours ago -
How do you explain that it is not fair for teachers to verbally
abuse you over...
asked 4 hours ago -
Ang Electronics, Inc., has developed a new HD DVD. If the HD DVD
is successful, the...
asked 5 hours ago -
which of these substances cannot behave as a lewis base in an aq
solution
a- Co...
asked 5 hours ago -
Below are some of Toyota’s (an automotive manufacturer) costs to
manufacture a car: I. Depreciation of...
asked 5 hours ago -
A random sample of 40 cups of coffee from a vending machine had
a sample mean...
asked 5 hours ago -
The mercury in a fish sample is determined to be 1.80, 1.58 and
1.64 ppm. Calculate...
asked 5 hours ago -
Suppose a photon is equally likely to be found anywhere in an
interval of 28.5 cm...
asked 5 hours ago -
Suppose the following is a divide-and-conquer algorithm for some
problem.
"Make the input of size n...
asked 6 hours ago