the data represents the time in minutes, spend reading a political blog in day. construct a...
the data represents the time in minutes, spend reading
a political blog in day. construct a frequency distribution using 5
classes in the table, include the midpoint, relative frequencies,
and cumulative freguencies. which class has the greatest frequency
and which has the least frequency?
8, 29, 20, 20, 22, 21, 11, 2, 6,10, 28,13,13,0, 1,23, 12, 8,
12,8
Homework Answers
In the given image I have calculated the class width and class
Interval.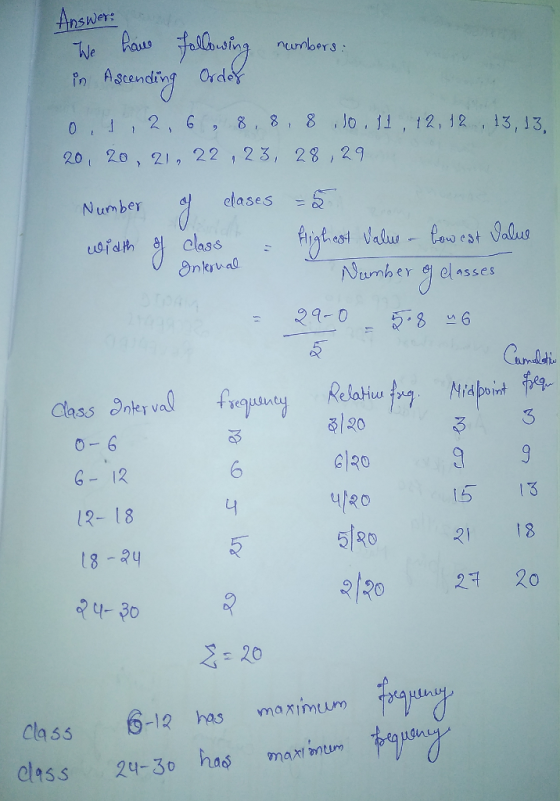
Add Answer to:
the data represents the time in minutes, spend reading
a political blog in day. construct a...
The data represent the time, in minutes, spent reading a political blog in a day. Construct...
The data represent the time, in minutes, spent reading a political blog in a day. Construct a frequency distribution using 5 classes. In the table, include the midpoints, relative frequencies, and cumulative frequencies. Which class has the greatest frequency and which has the least frequency? Data Set: 31 12 11 7 5 49 22 38 8 16 2 10 31 37 34 39 37 7 0 41
The data represent the time, in minutes, spent reading a political blog in a day
 The data represent the time, in minutes, spent reading a political blog in a day Construct a frequency distribution 23 using 5 classes in the table, include the midponts, relative frequencies, and cumulative frequencies. Which class has the greatest frequency and which has the least frequency? Complete the table, starting with the lowest class lmit (Simpldy your answers )
The data represent the time, in minutes, spent reading a political blog in a day.
 The data represent the time, in minutes, spent reading a political blog in a day. Construct a frequency distribution using 5 classes. In the table, include the midpoints, relative frequencies, and cumulative frequencies. Which class has the greatest frequency and which has the least frequency? Complete the table, starting with the lowest class limit (Simplify your answers)
0 The data represent the time, in minutes, spent reading a political blog in a day....
 0 The data represent the time, in minutes, spent reading a political blog in a day. Construct a frequency distribution using 5 classes. In the table, include the midpoints, relative frequencies, and cumulative frequencies. Which class has the greatest frequency and which has the least frequency? 2 12 13 11 6 11 14 19 9 8 19 14 12 19 0 18 7 18 17 1 Complete the table, starting with the lowest class limit. (Simplify your answers.) Relative Frequency...
answer 2.1.29 13 12 22 The data represent the time, in minutes spent reading a poltical...
 answer
2.1.29 13 12 22 The data represent the time, in minutes spent reading a poltical blog in a day Construct a trequency distntbution using 5 classes in the table, include trequencies Which class has the greatest frequency and which has the least frequency? 8 20 11 2 20 2 13 23 12 Complete the table, staring with the lowest class limit Simpility your answers) Relative Frequency Cumulative Frequency Frequency Midpoint Class Enter your answer in the edit felds and...
answer
2.1.29 13 12 22 The data represent the time, in minutes spent reading a poltical blog in a day Construct a trequency distntbution using 5 classes in the table, include trequencies Which class has the greatest frequency and which has the least frequency? 8 20 11 2 20 2 13 23 12 Complete the table, staring with the lowest class limit Simpility your answers) Relative Frequency Cumulative Frequency Frequency Midpoint Class Enter your answer in the edit felds and...
USING AND INTERPRETING CONCEPTS Constructing a Frequency Distribution In Exercises 29 and 30, construct a frequency...
 USING AND INTERPRETING CONCEPTS Constructing a Frequency Distribution In Exercises 29 and 30, construct a frequency distribution for the data set using the indicated number of classes. In the table, include the midpoints, relative frequencies, and cumulative frequencies Which class has the greatest frequency and which has the least frequency? 9 29, Political Blog Reading Times Number of classes: 5 Data set: Times (in minutes) spent reading a political blog in a day 7 39 13 9 25 8 22...
Construct a frequency distribution for the given data set using 6 classes. In the table, include...
 Construct a frequency distribution for the given data set using 6 classes. In the table, include the midpoints, relative frequencies, and cumulative frequencies. Which class has the greatest frequency and which has the least frequency? Amount (in dollars) spent on books for a semester 118 228 309 289 413 518 331 46 389 72 89 133 357 415 3850 42 476 170 40 103 121 75 315 334 402 138 324 289 331 Complete the table, starting with the lowest...
In Exercises 1 and 2, use the data set, which represents the overall average class sizes...
In Exercises 1 and 2, use the data set, which represents the overall average class sizes for 20 national universities. (Adapted from Public University Honors) 37 34 42 44 39 40 41 51 49 31 55 26 31 40 30 27 36 43 49 35 1. Construct a frequency distribution for the data set using five classes. Include class limits, midpoints, boundaries, frequencies, relative frequencies, and cumulative frequencies. 2. Construct a relative frequency histogram using the frequency distribution in Exercise...
The data set represents the numbers of minutes a sample of 27 people distribution for the...
 The data set represents the numbers of minutes a sample of 27 people distribution for the data set using five classes. 1. exercise each week. Construct a frequency 108 139 120 123 120 132 123 131 131 157 150 124 111 101 135 119 116 117 127 128 139 119 118 114 127 142 130 Classes Class boundaries Frequency Midpoint Relative Cumulative frequeney frequency Relative Frequency Histogram Cumulative Frequency Graph or Ogive Relative Frequency Histogram Cumulative Frequency Graph or Ogive
Construct a frequency distribution for the given data set using 6 classes. In the table, include...
 Construct a frequency distribution for the given data set using 6 classes. In the table, include the midpoints, relative frequencies, and cumulative frequencies. Which class has the greatest frequency and which has the least frequency? Amount (in dolars) spent on books for a semester 289 327 83 134 87 547 364 392 169 521 139 439 225 459 130p 322 327 44 248 163 419 405 499 255 144 199 108 271 Complete the table, starting with the lowest class...
 0 The data represent the time, in minutes, spent reading a political blog in a day. Construct a frequency distribution using 5 classes. In the table, include the midpoints, relative frequencies, and cumulative frequencies. Which class has the greatest frequency and which has the least frequency? 2 12 13 11 6 11 14 19 9 8 19 14 12 19 0 18 7 18 17 1 Complete the table, starting with the lowest class limit. (Simplify your answers.) Relative Frequency...
 answer
2.1.29 13 12 22 The data represent the time, in minutes spent reading a poltical blog in a day Construct a trequency distntbution using 5 classes in the table, include trequencies Which class has the greatest frequency and which has the least frequency? 8 20 11 2 20 2 13 23 12 Complete the table, staring with the lowest class limit Simpility your answers) Relative Frequency Cumulative Frequency Frequency Midpoint Class Enter your answer in the edit felds and...
answer
2.1.29 13 12 22 The data represent the time, in minutes spent reading a poltical blog in a day Construct a trequency distntbution using 5 classes in the table, include trequencies Which class has the greatest frequency and which has the least frequency? 8 20 11 2 20 2 13 23 12 Complete the table, staring with the lowest class limit Simpility your answers) Relative Frequency Cumulative Frequency Frequency Midpoint Class Enter your answer in the edit felds and...
 USING AND INTERPRETING CONCEPTS Constructing a Frequency Distribution In Exercises 29 and 30, construct a frequency distribution for the data set using the indicated number of classes. In the table, include the midpoints, relative frequencies, and cumulative frequencies Which class has the greatest frequency and which has the least frequency? 9 29, Political Blog Reading Times Number of classes: 5 Data set: Times (in minutes) spent reading a political blog in a day 7 39 13 9 25 8 22...
 Construct a frequency distribution for the given data set using 6 classes. In the table, include the midpoints, relative frequencies, and cumulative frequencies. Which class has the greatest frequency and which has the least frequency? Amount (in dollars) spent on books for a semester 118 228 309 289 413 518 331 46 389 72 89 133 357 415 3850 42 476 170 40 103 121 75 315 334 402 138 324 289 331 Complete the table, starting with the lowest...
 The data set represents the numbers of minutes a sample of 27 people distribution for the data set using five classes. 1. exercise each week. Construct a frequency 108 139 120 123 120 132 123 131 131 157 150 124 111 101 135 119 116 117 127 128 139 119 118 114 127 142 130 Classes Class boundaries Frequency Midpoint Relative Cumulative frequeney frequency Relative Frequency Histogram Cumulative Frequency Graph or Ogive Relative Frequency Histogram Cumulative Frequency Graph or Ogive
 Construct a frequency distribution for the given data set using 6 classes. In the table, include the midpoints, relative frequencies, and cumulative frequencies. Which class has the greatest frequency and which has the least frequency? Amount (in dolars) spent on books for a semester 289 327 83 134 87 547 364 392 169 521 139 439 225 459 130p 322 327 44 248 163 419 405 499 255 144 199 108 271 Complete the table, starting with the lowest class...
Most questions answered within 3 hours.
-
In C++ Programming, Try using loops only.
This lab demonstrates the use of the While Loop...
asked 38 minutes ago -
Effect of DCMU and sodium azide on Chlamydomonas? We did an
experiment where we had Chlamydomonas...
asked 1 hour ago -
1a) According to the ideal gas law, _______________.
a. a gas has infinite volume at absolute...
asked 2 hours ago -
Oakdale Fashions, Inc. had $245,000 in 2018 taxable income.
Using the tax schedule in Table 2.3...
asked 3 hours ago -
The marketing class at CSUS had an average score of 150. An
educational analyst determined that...
asked 4 hours ago -
Justin Case has purchased a $250 000 home by putting 20 % down
and taking out...
asked 4 hours ago -
1. In a labor market, marginal cost for a firm is
____________.
a. recruiting cost
b....
asked 5 hours ago -
On January 1, 2019, ABC Company issued $60,000,000 of 20-year,
10.5% bonds when the market rate...
asked 5 hours ago -
39.4% of US homes continue to use a landline in addition to cell
phone service. 3...
asked 6 hours ago -
Starting with benzene, synthesize 1-phenyl-1-butyne.
Show intermediates and reagents.
asked 7 hours ago -
Create a 32-run crossed array design with six control factors
and two noise factors such that...
asked 8 hours ago -
A 500g sample of sand from source A has the following amounts
retained on each sieve....
asked 8 hours ago