The following are the consolidated statement of earnings and the balance sheet of Home Depot, Inc...
The following are the consolidated statement of earnings and the balance sheet of Home Depot, Inc and Subsidiaries.
| THE HOME DEPOT, INC. AND SUBSIDIARIES CONSOLIDATED STATEMENTS OF EARNINGS |
|||||||||||
| Fiscal Year Ended(1) | |||||||||||
| amounts in millions, except per share data | January 31, 2016 |
February 1, 2015 |
February 2, 2014 |
||||||||
| NET SALES | $ | 88,519 | $ | 83,176 | $ | 78,812 | |||||
| Cost of Sales | 58,254 | 54,787 | 51,897 | ||||||||
| GROSS PROFIT | 30,265 | 28,389 | 26,915 | ||||||||
| Operating Expenses: | |||||||||||
| Selling, General and Administrative | 16,801 | 16,280 | 16,122 | ||||||||
| Depreciation and Amortization | 1,690 | 1,640 | 1,627 | ||||||||
| Total Operating Expenses | 18,491 | 17,920 | 17,749 | ||||||||
| OPERATING INCOME | 11,774 | 10,469 | 9,166 | ||||||||
| Interest and Other (Income) Expense: | |||||||||||
| Interest and Investment Income | (166 | ) | (337 | ) | (12 | ) | |||||
| Interest Expense | 919 | 830 | 711 | ||||||||
| Interest and Other, net | 753 | 493 | 699 | ||||||||
| EARNINGS BEFORE PROVISION FOR INCOME TAXES | 11,021 | 9,976 | 8,467 | ||||||||
| Provision for Income Taxes | 4,012 | 3,631 | 3,082 | ||||||||
| NET EARNINGS | $ | 7,009 | $ | 6,345 | $ | 5,385 | |||||
| Weighted Average Common Shares | 1,277 | 1,338 | 1,425 | ||||||||
| BASIC EARNINGS PER SHARE | $ | 5.49 | $ | 4.74 | $ | 3.78 | |||||
| Diluted Weighted Average Common Shares | 1,283 | 1,346 | 1,434 | ||||||||
| DILUTED EARNINGS PER SHARE | $ | 5.46 | $ | 4.71 | $ | 3.76 | |||||
(1) Fiscal years ended January 31, 2016, February 1, 2015 and February 2, 2014 include 52 weeks.
| THE HOME DEPOT, INC. AND SUBSIDIARIES CONSOLIDATED BALANCE SHEETS |
|||||||
| amounts in millions, except share and per share data | January 31, 2016 |
February 1, 2015 |
|||||
| ASSETS | |||||||
| Current Assets: | |||||||
| Cash and Cash Equivalents | $ | 2,216 | $ | 1,723 | |||
| Receivables, net | 1,890 | 1,484 | |||||
| Merchandise Inventories | 11,809 | 11,079 | |||||
| Other Current Assets | 1,078 | 1,016 | |||||
| Total Current Assets | 16,993 | 15,302 | |||||
| Property and Equipment, at cost | 39,266 | 38,513 | |||||
| Less Accumulated Depreciation and Amortization | 17,075 | 15,793 | |||||
| Net Property and Equipment | 22,191 | 22,720 | |||||
| Goodwill | 2,102 | 1,353 | |||||
| Other Assets | 1,263 | 571 | |||||
| Total Assets | $ | 42,549 | $ | 39,946 | |||
| LIABILITIES AND STOCKHOLDERS’ EQUITY | |||||||
| Current Liabilities: | |||||||
| Short-Term Debt | $ | 350 | $ | 290 | |||
| Accounts Payable | 6,565 | 5,807 | |||||
| Accrued Salaries and Related Expenses | 1,515 | 1,391 | |||||
| Sales Taxes Payable | 476 | 434 | |||||
| Deferred Revenue | 1,566 | 1,468 | |||||
| Income Taxes Payable | 34 | 35 | |||||
| Current Installments of Long-Term Debt | 77 | 38 | |||||
| Other Accrued Expenses | 1,943 | 1,806 | |||||
| Total Current Liabilities | 12,526 | 11,269 | |||||
| Long-Term Debt, excluding current installments | 20,888 | 16,869 | |||||
| Other Long-Term Liabilities | 1,965 | 1,844 | |||||
| Deferred Income Taxes | 854 | 642 | |||||
| Total Liabilities | 36,233 | 30,624 | |||||
| STOCKHOLDERS’ EQUITY | |||||||
| Common Stock, par value $0.05; authorized: 10 billion shares;
issued: 1.772 billion shares at January 31, 2016 and 1.768 billion shares at February 1, 2015; outstanding: 1.252 billion shares at January 31, 2016 and 1.307 billion shares at February 1, 2015 |
88 | 88 | |||||
| Paid-In Capital | 9,347 | 8,885 | |||||
| Retained Earnings | 30,973 | 26,995 | |||||
| Accumulated Other Comprehensive Loss | (898 | ) | (452 | ) | |||
| Treasury Stock, at cost, 520 million shares at January 31, 2016
and 461 million shares at February 1, 2015 |
(33,194 | ) | (26,194 | ) | |||
| Total Stockholders’ Equity | 6,316 | 9,322 | |||||
| Total Liabilities and Stockholders’ Equity | $ | 42,549 | $ | 39,946 | |||
Selected information as on February 2, 2014:
| Working capital | $ | 4,530 | ||
| Cash balance | $ | 1,929 | ||
| Total assets | $ | 40,518 | ||
| Stockholders' equity | $ | 12,522 | ||
Assume that you are the credit manager of a medium-size supplier of building materials and related products. Home Depot wants to make credit purchases from your company, with payment due in 60 days.
Instructions:
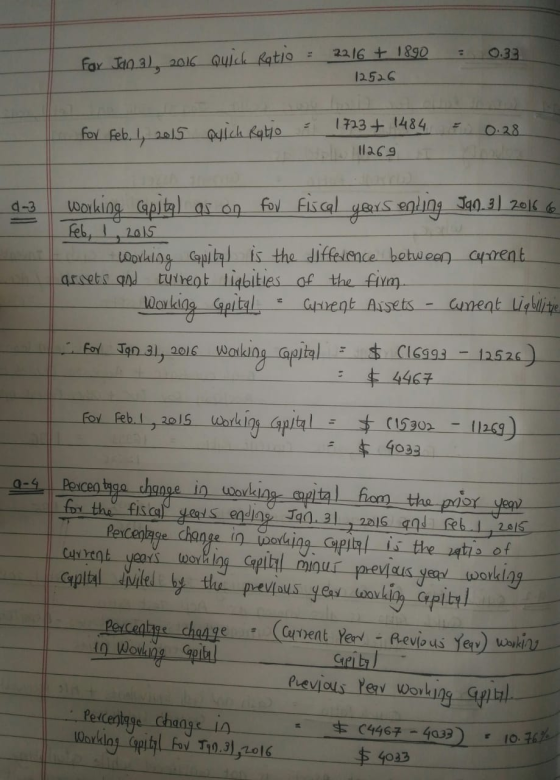
a-1. Compute the current ratio for the fiscal years ending January 31, 2016, and February 1, 2015.
a-2. Compute the quick ratio for the fiscal years ending January 31, 2016, and February 1, 2015.
a-3. Compute the amount of working capital for the fiscal years ending January 31, 2016, and February 1, 2015.
a-4. Compute the percentage change in working capital from the prior year for the fiscal years ending January 31, 2016, and February 1, 2015.
a-5. Compute the percentage change in cash and cash equivalents from the prior year for the fiscal years ending January 31, 2016, and February 1, 2015.
Homework Answers


Add Answer to:
The following are the consolidated statement of earnings and the
balance sheet of Home Depot, Inc...
The following are the consolidated statement of earnings and the balance sheet of Home Depot, Inc...
The following are the consolidated statement of earnings and the balance sheet of Home Depot, Inc and Subsidiaries. THE HOME DEPOT, INC. AND SUBSIDIARIES CONSOLIDATED STATEMENTS OF EARNINGS Fiscal Year Ended(1) amounts in millions, except per share data January 31, 2016 February 1, 2015 February 2, 2014 NET SALES $ 88,519 $ 83,176 $ 78,812 Cost of Sales 58,254 54,787 51,897 GROSS PROFIT 30,265 28,389 26,915 Operating Expenses: Selling, General and Administrative 16,801 16,280 16,122 Depreciation and Amortization 1,690 1,640...
Required information The following are the consolidated statement of earnings and the balance sheet of Home...
Required information The following are the consolidated statement of earnings and the balance sheet of Home Depot, Inc and Subsidiaries. THE HOME DEPOT, INC. AND SUBSIDIARIES CONSOLIDATED STATEMENTS OF EARNINGS Fiscal Year Ended(1) amounts in millions, except per share data January 31, 2016 February 1, 2015 February 2, 2014 NET SALES $ 88,519 $ 83,176 $ 78,812 Cost of Sales 58,254 54,787 51,897 GROSS PROFIT 30,265 28,389 26,915 Operating Expenses: Selling, General and Administrative 16,801 16,280 16,122 Depreciation and Amortization...
THE HOME DEPOT, INC. AND SUBSIDIARIES CONSOLIDATED STATEMENTS OF EARNINGS Fiscal Year Ended(1) amounts in millions,...
THE HOME DEPOT, INC. AND SUBSIDIARIES CONSOLIDATED STATEMENTS OF EARNINGS Fiscal Year Ended(1) amounts in millions, except per share data January 31, 2016 February 1, 2015 February 2, 2014 NET SALES $ 88,519 $ 83,176 $ 78,812 Cost of Sales 58,254 54,787 51,897 GROSS PROFIT 30,265 28,389 26,915 Operating Expenses: Selling, General and Administrative 16,801 16,280 16,122 Depreciation and Amortization 1,690 1,640 1,627 Total Operating Expenses 18,491 17,920 17,749 OPERATING INCOME 11,774 10,469 9,166 Interest and Other (Income) Expense: Interest...
Required information The following are the consolidated statement of earnings and the balance sheet of Home...
 Required information
The following are the consolidated statement of earnings and the
balance sheet of Home Depot, Inc and Subsidiaries.
THE HOME DEPOT, INC. AND SUBSIDIARIES
CONSOLIDATED STATEMENTS OF EARNINGS
Fiscal Year Ended(1)
amounts in millions, except per share data
January
31,2016
February
1, 2015
February
2, 2014
NET SALES
$
66,181
$
71,294
$
77,359
Cost of Sales
43,756
47,283
51,349
GROSS PROFIT
22,425
24,011
26,010
Operating Expenses:
Selling, General and Administrative
15,897
17,832
17,052
Depreciation and Amortization
1,702...
Required information
The following are the consolidated statement of earnings and the
balance sheet of Home Depot, Inc and Subsidiaries.
THE HOME DEPOT, INC. AND SUBSIDIARIES
CONSOLIDATED STATEMENTS OF EARNINGS
Fiscal Year Ended(1)
amounts in millions, except per share data
January
31,2016
February
1, 2015
February
2, 2014
NET SALES
$
66,181
$
71,294
$
77,359
Cost of Sales
43,756
47,283
51,349
GROSS PROFIT
22,425
24,011
26,010
Operating Expenses:
Selling, General and Administrative
15,897
17,832
17,052
Depreciation and Amortization
1,702...
included in Appetit LO13-1, LO13-2, LO13-4 EXERCISE 13.15 Home Depot, Inc. Using a Statement of Cash...
 included in Appetit LO13-1, LO13-2, LO13-4 EXERCISE 13.15 Home Depot, Inc. Using a Statement of Cash Flows Statements of cash flow for Home Depot, Inc., for 2013, 2014, and 2013 are include of this text. a. Focus on the information for 2015 (year ending January 31, 2010). How does compare with net cash provided by or used in operations, and what accounts for the difference between the two amounts? does not eating unts for the per the major uses of...
Refer to the financial statements of The Home Depot in Appendix A. (Note: Fiscal 2016 for...
 Refer to the financial statements of The Home Depot in Appendix
A. (Note: Fiscal 2016 for The Home Depot runs from February 1,
2016, to January 29, 2017. As with many retail companies, The Home
Depot labels the period “Fiscal 2016” even though it ends in the
2017 calendar year. The label “Fiscal 2016” is appropriate because
Fiscal 2016 includes 11 months from the 2016 calendar year. The
Home Depot explains its choice of fiscal period in Note 1 to...
Refer to the financial statements of The Home Depot in Appendix
A. (Note: Fiscal 2016 for The Home Depot runs from February 1,
2016, to January 29, 2017. As with many retail companies, The Home
Depot labels the period “Fiscal 2016” even though it ends in the
2017 calendar year. The label “Fiscal 2016” is appropriate because
Fiscal 2016 includes 11 months from the 2016 calendar year. The
Home Depot explains its choice of fiscal period in Note 1 to...
The Home Depot, Inc., financial statements appear in Appendix A at the end of this textbook. a. Identify where...
 The Home Depot, Inc., financial statements appear in Appendix A at the end of this textbook. a. Identify where you can tell that the company uses straight-line depreciation. b. Which of the following statement is false? c. Using information from the consolidated financial statements, calculate the following for the year ended February 1, 2015: a) Net Income, b) Gross profit as a % of sales, c) Current ratio at February 1. 2015, d) Current ratio at the end of the...
THE HOME DEPOT, INC. CONSOLIDATED BALANCE SHEETS February 3, 2019 January 28, 2018 in millions, except per share data A...
 THE HOME DEPOT, INC. CONSOLIDATED BALANCE SHEETS February 3, 2019 January 28, 2018 in millions, except per share data Assets Current assets: Cash and cash equivalents 1,778 $ 3,595 Receivables, net 1,936 1,952 Merchandise inventories 13,925 12,748 Other current assets 890 638 Total current assets 18,529 18,933 22,375 Net property and equipment 22,075 Goodwill 2,252 2,275 Other assets 847 1,246 Total assets 44,003 44,529 Liabilities and Stockholders' Equity Current liabilities: 1,339 $ Short-term debt $ 1,559 Accounts payable Accrued salaries...
 Required information
The following are the consolidated statement of earnings and the
balance sheet of Home Depot, Inc and Subsidiaries.
THE HOME DEPOT, INC. AND SUBSIDIARIES
CONSOLIDATED STATEMENTS OF EARNINGS
Fiscal Year Ended(1)
amounts in millions, except per share data
January
31,2016
February
1, 2015
February
2, 2014
NET SALES
$
66,181
$
71,294
$
77,359
Cost of Sales
43,756
47,283
51,349
GROSS PROFIT
22,425
24,011
26,010
Operating Expenses:
Selling, General and Administrative
15,897
17,832
17,052
Depreciation and Amortization
1,702...
Required information
The following are the consolidated statement of earnings and the
balance sheet of Home Depot, Inc and Subsidiaries.
THE HOME DEPOT, INC. AND SUBSIDIARIES
CONSOLIDATED STATEMENTS OF EARNINGS
Fiscal Year Ended(1)
amounts in millions, except per share data
January
31,2016
February
1, 2015
February
2, 2014
NET SALES
$
66,181
$
71,294
$
77,359
Cost of Sales
43,756
47,283
51,349
GROSS PROFIT
22,425
24,011
26,010
Operating Expenses:
Selling, General and Administrative
15,897
17,832
17,052
Depreciation and Amortization
1,702...
 included in Appetit LO13-1, LO13-2, LO13-4 EXERCISE 13.15 Home Depot, Inc. Using a Statement of Cash Flows Statements of cash flow for Home Depot, Inc., for 2013, 2014, and 2013 are include of this text. a. Focus on the information for 2015 (year ending January 31, 2010). How does compare with net cash provided by or used in operations, and what accounts for the difference between the two amounts? does not eating unts for the per the major uses of...
 Refer to the financial statements of The Home Depot in Appendix
A. (Note: Fiscal 2016 for The Home Depot runs from February 1,
2016, to January 29, 2017. As with many retail companies, The Home
Depot labels the period “Fiscal 2016” even though it ends in the
2017 calendar year. The label “Fiscal 2016” is appropriate because
Fiscal 2016 includes 11 months from the 2016 calendar year. The
Home Depot explains its choice of fiscal period in Note 1 to...
Refer to the financial statements of The Home Depot in Appendix
A. (Note: Fiscal 2016 for The Home Depot runs from February 1,
2016, to January 29, 2017. As with many retail companies, The Home
Depot labels the period “Fiscal 2016” even though it ends in the
2017 calendar year. The label “Fiscal 2016” is appropriate because
Fiscal 2016 includes 11 months from the 2016 calendar year. The
Home Depot explains its choice of fiscal period in Note 1 to...
 The Home Depot, Inc., financial statements appear in Appendix A at the end of this textbook. a. Identify where you can tell that the company uses straight-line depreciation. b. Which of the following statement is false? c. Using information from the consolidated financial statements, calculate the following for the year ended February 1, 2015: a) Net Income, b) Gross profit as a % of sales, c) Current ratio at February 1. 2015, d) Current ratio at the end of the...
 THE HOME DEPOT, INC. CONSOLIDATED BALANCE SHEETS February 3, 2019 January 28, 2018 in millions, except per share data Assets Current assets: Cash and cash equivalents 1,778 $ 3,595 Receivables, net 1,936 1,952 Merchandise inventories 13,925 12,748 Other current assets 890 638 Total current assets 18,529 18,933 22,375 Net property and equipment 22,075 Goodwill 2,252 2,275 Other assets 847 1,246 Total assets 44,003 44,529 Liabilities and Stockholders' Equity Current liabilities: 1,339 $ Short-term debt $ 1,559 Accounts payable Accrued salaries...
Most questions answered within 3 hours.
-
Exercise 5-22A Complete the accounting cycle using receivable
transactions (LO5–1, 5–2, 5–4, 5–5, 5–7) [The following...
asked 37 seconds ago -
Do you agree with the view that small businesses are more
vulnerable to employee theft because...
asked 20 minutes ago -
Four forces act on an object, given by A = 41.3 N east, B = 46.3...
asked 1 hour ago -
Which of the following design considerations leads to more
user-friendly presentation layers for GUIs? [Check all...
asked 1 hour ago -
38%
of adults say cashews are their favorite kind of nut. You
randomly select 12 adults...
asked 4 hours ago -
Notational Inc. is considering installing a new server. The
machine costs $100,000 and is expected to...
asked 4 hours ago -
Given the information coding of DNA strand:
5'-TTT-TAC-GAA-GAG-TGA-3',
Write the corresponding DNA template and mRNA strand...
asked 4 hours ago -
2. Boris recently synthesized an explosive compound he named
Badenoughium. The molecular formula for Bdenoughium is...
asked 8 hours ago -
5. A car decelerate evenly from a velocity of 50mph until rest
in a distance of...
asked 8 hours ago -
IN HTML Programming
1. Write a script that inputs integers (one at a time) and
passes...
asked 8 hours ago -
A dentist uses a mirror to examine a tooth that is 0.75 cm in
front of...
asked 8 hours ago -
You set up a 100,000 line of credit for the business on 1/1/X8,
annual interest is...
asked 8 hours ago