3. Profit maximization using total cost and total revenue curves Suppose Maria runs a small business...
3. Profit maximization using total cost and total revenue curves
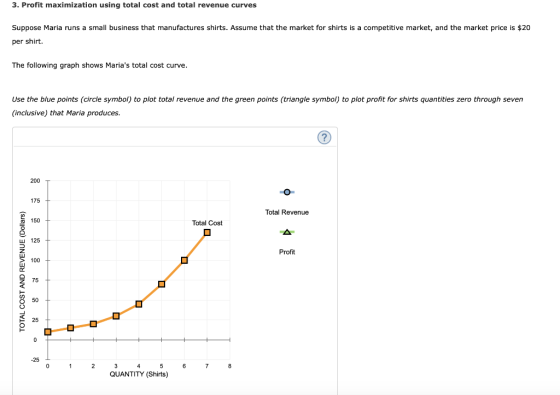
Suppose Maria runs a small business that manufactures shirts. Assume that the market for shirts is a competitive market, and the market price is $20 per shirt.
The following graph shows Maria's total cost curve.
Use the blue points (circle symbol) to plot total revenue and the green points (triangle symbol) to plot profit for shirts quantities zero through seven (inclusive) that Maria produces.
Calculate Maria's marginal revenue and marginal cost for the first seven shirts she produces, and plot them on the following graph. Use the blue points (circle symbol) to plot marginal revenue and the orange points (square symbol) to plot marginal cost at each quantity.
Maria's profit is maximized when she produces _______ shirts. When she does this, the marginal cost of the last shirt she produces is $_______ , which is _______ than the price Maria receives for each shirt she sells. The marginal cost of producing an additional shirt (that is, one more shirt than would maximize her profit) is $_______ , which is _______ than the price Maria receives for each shirt she sells. Therefore, Maria's profitmaximizing quantity corresponds to the intersection of the _______ curves. Because Maria is a price taker, this last condition can also be written as _______

Homework Answers
| Q | TC | TR | Profit | MC | MR |
| 0 | 10 | 0 | -10 | ||
| 1 | 15 | 20 | 5 | 5 | 20 |
| 2 | 20 | 40 | 20 | 5 | 20 |
| 3 | 30 | 60 | 30 | 10 | 20 |
| 4 | 45 | 80 | 35 | 15 | 20 |
| 5 | 70 | 100 | 30 | 25 | 20 |
| 6 | 100 | 120 | 20 | 30 | 20 |
| 7 | 135 | 140 | 5 | 35 | 20 |


Blanks-
1) 4
2) 15
3) less
4) 25
5) more
6) MC=MR
7) P=MC
Add Answer to:
3. Profit maximization using total cost and total revenue curves Suppose Maria runs a small business...
1. Profit maximization using total cost and total revenue curves Suppose Alyssa runs a small business that manufactures...
 1. Profit maximization using total cost and total revenue curvesSuppose Alyssa runs a small business that manufactures shirts. Assume that the market for shirts is a competitive market, and the market price is $20 per shirt.The following graph shows Alyssa's total cost curve.Use the blue points (circle symbol) to plot total revenue and the green points (triangle symbol) to plot profit for shirts quantities zero through seven (inclusive) that Alyssa produces.Calculate Alyssa's marginal revenue and marginal cost for the first...
Profit maximization using total cost and total revenue curves Suppose Kate runs a small business that...
 Profit maximization using total cost and total revenue
curves
Suppose Kate runs a small business that manufactures shirts.
Assume that the market for shirts is a competitive market, and the
market price is $20 per shirt.
The following graph shows Kate's total cost curve.
Use the blue points (circle symbol) to plot total revenue and
the green points (triangle symbol) to plot profit for the first
seven shirts that Kate produces, including zero shirts.
Calculate Kate's marginal revenue and marginal...
Profit maximization using total cost and total revenue
curves
Suppose Kate runs a small business that manufactures shirts.
Assume that the market for shirts is a competitive market, and the
market price is $20 per shirt.
The following graph shows Kate's total cost curve.
Use the blue points (circle symbol) to plot total revenue and
the green points (triangle symbol) to plot profit for the first
seven shirts that Kate produces, including zero shirts.
Calculate Kate's marginal revenue and marginal...
3. Profit maximization using total cost and total revenue curves
 3. Profit maximization using total cost and total revenue curves Suppose Kenji runs a small business that manufactures shirts. Assume that the market for shirts is a competitive market, and the market price is $25 per shirt. The following graph shows Kenji's total cost curve. Use the blue points (circle symbol) to plot total revenue and the green points (triangle symbol) to plot profit for the first seven shirts that Kenju produces, including zero shirts. Calculate Kenj's marginal revenue and marginal cost for the...
1. Profit maximization using total cost and total revenue curves Suppose Juanita runs a small business...
 1. Profit maximization using total cost and total revenue curvesSuppose Juanita runs a small business that manufactures teddy bears. Assume that the market for teddy bears is a competitive market, and the market price is $20 per teddy bear.The following graph shows Juanita's total cost curve.Use the blue points (circle symbol) to plot total revenue and the green points (triangle symbol) to plot profit for teddy bears quantities zero through seven (inclusive) that Juanita produces.Calculate Juanita's marginal revenue and marginal...
ttempts: ampts: 0 Keep the Highest: 0/3 3. Profit maximization using total cost and total revenue...
 ttempts: ampts: 0 Keep the Highest: 0/3 3. Profit maximization using total cost and total revenue curves Suppose Sean runs a small business that manufactures shirts. Assume that the market for shirts is a competitive market, and the market price is $20 per shirt. The following graph shows Sean's total cost curve. Use the blue points (circle symbol) to plot total revenue and the green points (triangle symbol) to plot profit for shirts quantities zero through seven (inclusive) that Sean...
3. Profit maximization using total cost and total revenue curves Suppose Yakov runs a small business...
 3. Profit maximization using total cost and total revenue curvesSuppose Yakov runs a small business that manufactures frying pans. Assume that the market for frying pans is a perfectly competitive market, and the market price is $20 per frying pan.The following graph shows Yakov's total cost curve.Use the blue points (circle symbol) to plot total revenue and the green points (triangle symbol) to plot profit for the first seven frying pans that Yakov produces, including zero frying pans.Calculate Yakov's marginal...
3. Profit maximization using total cost and total revenue curves Suppose Alex runs a small business...
 3. Profit maximization using total cost and total revenue curves Suppose Alex runs a small business that manufactures teddy bears. Assume that the market for teddy bears is a competitive market, and the market price is $25 per teddy bear. The following graph shows Alex's total cost curve. Use the blue points (circle symbol) to plot total revenue and the green points (triangle symbol) to plot profit for the first seven teddy bears that Alex produces, including zero teddy bears...
3. Profit maximization using total cost and total revenue curves
 3. Profit maximization using total cost and total revenue curvesSuppose Edison runs a small business that manufactures frying pans. Assume that the market for frying pans is a competitive market, and the market price is $20 per frying pan.The following graph shows Edison's total cost curve.Use the blue points (circle symbol) to plot total revenue and the green points (triangle symbol) to plot profit for frying pans quantities zero through seven (inclusive) that Edison produces.Calculate Edison's marginal revenue and marginal...
3. Profit maximization using total cost and total revenue curves Suppose Carlos runs a small business...
 3. Profit maximization using total cost and total revenue curves Suppose Carlos runs a small business that manufactures teddy bears, Assume that the market for teddy bears is a perfectly competitive market, and the market price is $25 per teddy bear The following graph shows Carlos's total cost curve. Use the blue points (circle symbol) to plot total revenue and the green points (eriangle symbol) to plot proft for the irst seven tedy bears that Carlos produces, including zero teddy...
help me correct the graph and finish the problem and explain it please! 3. Profit maximization...
 help me correct the graph and finish the problem and explain it
please!
3. Profit maximization using total cost and total revenue curves Suppose Manuel runs a small business that manufactures shirts. Assume that the market for shirts is a price-taker market, and the market price is $10 per shirt. The following graph shows Manuel's total cost curve. Use the blue points (circle symbol) to plot total revenue, and the green points (triangle symbol) to plot profit for the first...
help me correct the graph and finish the problem and explain it
please!
3. Profit maximization using total cost and total revenue curves Suppose Manuel runs a small business that manufactures shirts. Assume that the market for shirts is a price-taker market, and the market price is $10 per shirt. The following graph shows Manuel's total cost curve. Use the blue points (circle symbol) to plot total revenue, and the green points (triangle symbol) to plot profit for the first...
 1. Profit maximization using total cost and total revenue curvesSuppose Alyssa runs a small business that manufactures shirts. Assume that the market for shirts is a competitive market, and the market price is $20 per shirt.The following graph shows Alyssa's total cost curve.Use the blue points (circle symbol) to plot total revenue and the green points (triangle symbol) to plot profit for shirts quantities zero through seven (inclusive) that Alyssa produces.Calculate Alyssa's marginal revenue and marginal cost for the first...
 Profit maximization using total cost and total revenue
curves
Suppose Kate runs a small business that manufactures shirts.
Assume that the market for shirts is a competitive market, and the
market price is $20 per shirt.
The following graph shows Kate's total cost curve.
Use the blue points (circle symbol) to plot total revenue and
the green points (triangle symbol) to plot profit for the first
seven shirts that Kate produces, including zero shirts.
Calculate Kate's marginal revenue and marginal...
Profit maximization using total cost and total revenue
curves
Suppose Kate runs a small business that manufactures shirts.
Assume that the market for shirts is a competitive market, and the
market price is $20 per shirt.
The following graph shows Kate's total cost curve.
Use the blue points (circle symbol) to plot total revenue and
the green points (triangle symbol) to plot profit for the first
seven shirts that Kate produces, including zero shirts.
Calculate Kate's marginal revenue and marginal...
 ttempts: ampts: 0 Keep the Highest: 0/3 3. Profit maximization using total cost and total revenue curves Suppose Sean runs a small business that manufactures shirts. Assume that the market for shirts is a competitive market, and the market price is $20 per shirt. The following graph shows Sean's total cost curve. Use the blue points (circle symbol) to plot total revenue and the green points (triangle symbol) to plot profit for shirts quantities zero through seven (inclusive) that Sean...
 3. Profit maximization using total cost and total revenue curves Suppose Alex runs a small business that manufactures teddy bears. Assume that the market for teddy bears is a competitive market, and the market price is $25 per teddy bear. The following graph shows Alex's total cost curve. Use the blue points (circle symbol) to plot total revenue and the green points (triangle symbol) to plot profit for the first seven teddy bears that Alex produces, including zero teddy bears...
 3. Profit maximization using total cost and total revenue curvesSuppose Edison runs a small business that manufactures frying pans. Assume that the market for frying pans is a competitive market, and the market price is $20 per frying pan.The following graph shows Edison's total cost curve.Use the blue points (circle symbol) to plot total revenue and the green points (triangle symbol) to plot profit for frying pans quantities zero through seven (inclusive) that Edison produces.Calculate Edison's marginal revenue and marginal...
 3. Profit maximization using total cost and total revenue curves Suppose Carlos runs a small business that manufactures teddy bears, Assume that the market for teddy bears is a perfectly competitive market, and the market price is $25 per teddy bear The following graph shows Carlos's total cost curve. Use the blue points (circle symbol) to plot total revenue and the green points (eriangle symbol) to plot proft for the irst seven tedy bears that Carlos produces, including zero teddy...
 help me correct the graph and finish the problem and explain it
please!
3. Profit maximization using total cost and total revenue curves Suppose Manuel runs a small business that manufactures shirts. Assume that the market for shirts is a price-taker market, and the market price is $10 per shirt. The following graph shows Manuel's total cost curve. Use the blue points (circle symbol) to plot total revenue, and the green points (triangle symbol) to plot profit for the first...
help me correct the graph and finish the problem and explain it
please!
3. Profit maximization using total cost and total revenue curves Suppose Manuel runs a small business that manufactures shirts. Assume that the market for shirts is a price-taker market, and the market price is $10 per shirt. The following graph shows Manuel's total cost curve. Use the blue points (circle symbol) to plot total revenue, and the green points (triangle symbol) to plot profit for the first...
Most questions answered within 3 hours.
-
A horizontal mass of M=5kg is on a spring and stretched to
x=0.5m when released from...
asked 3 minutes ago -
26 of 50
"I have worked at the Arizona Humane Society for ten years, and
have...
asked 24 minutes ago -
Compare and contrast zero based budgeting and incremental (or
base year) budgeting.
asked 22 minutes ago -
4 pts 10. Which of the following hypothesis would be MOST
difficult to test experimentally? Group...
asked 24 minutes ago -
A business owner makes 1,000 items a day. Each day he or she
contributes eight hours...
asked 26 minutes ago -
A
circular loop in the plane of a paper lies inca0.65 T magnetic
field pointing into...
asked 43 minutes ago -
A business owner is trying to decide whether to buy, rent, or
lease office space and...
asked 44 minutes ago -
Thermal Storage Solar heating of a house is much more efficient
if there is a way...
asked 1 hour ago -
Considering the “fits” for group and job design dimensions,
suppose you had 12 employees with different...
asked 1 hour ago -
Consider TCP connection management.
How many segments are typically involved in the TCP connection
establishment? What...
asked 1 hour ago -
1. You placed a stop-loss order to sell 500 shares of AAPL with
a stop price...
asked 1 hour ago -
Sylva Warehousing desired to locate a central warehouse to serve
five North Carolina markets. Placed on...
asked 1 hour ago