5. Consider total cost and total revenue given in the following table:
5. Consider total cost and total revenue given in the following table:

a. Calculate profit for each quantity. How much should the firm produce to maximize profit?
b. Calculate marginal revenue and marginal cost for each quantity. Graph them. (Hint: Put the points between whole numbers. For example, the marginal cost between 2 and 3 should be graphed at 2/½.)
c. At what quantity do the curves in part b cross? How does this relate to your answer to part a.?
d. Can you tell whether this firm is in a competitive industry?
e. Is the industry in long-run equilibrium?
Homework Answers
| Q | TC | TR | MC | MR | PROFIT |
| 0 | 24 | 0 | -24 | ||
| 0.5 | 3 | 24 | |||
| 1 | 27 | 24 | -3 | ||
| 1.5 | 3 | 24 | |||
| 2 | 30 | 48 | 18 | ||
| 2.5 | 3 | 24 | |||
| 3 | 33 | 72 | 39 | ||
| 3.5 | 6 | 24 | |||
| 4 | 39 | 96 | 57 | ||
| 4.5 | 21 | 24 | |||
| 5 | 60 | 120 | 60 | ||
| 5.5 | 27 | 24 | |||
| 6 | 87 | 144 | 57 | ||
| 6.5 | 32 | 24 | |||
| 7 | 119 | 168 | 49 |
a) Profit = TR-TC
The firm will set MC=MR for profit maximization and should produce 5 units to maximize profits
b) MR = change in TR/change in Q
MC = change in TC/change in Q
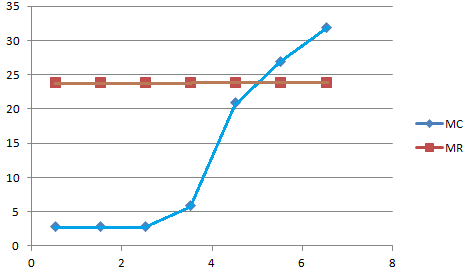
c) They intersect each other at Q=5 units as found out in part a
d) This firm is in a competitive industry as the MR is constant
e) No, because in the long run the profits are zero whereas this industry is having positive economic profits.
Add Answer to:
5. Consider total cost and total revenue given in the following table:
Consider total cost and total revenue given in the table below:
. Consider total cost and total revenue given in the table below:QUANTITY 0 1 2 3 4 5 6 7Total cost $8 $9 $10 $11 $13 $19 $27 $37Total revenue 0 8 16 24 32 40 48 56a. Calculate profit for each quantity. How much should the firm produce to maximize profit?b. Calculate marginal revenue and marginal cost for each quantity. Graph them. (Hint: Put the points between whole numbers. For example, the marginal cost between 2 and 3 should...
Consider total cost and total revenue, given in the following table: In the final column, enter...
 Consider total cost and total revenue, given in the following
table:
In the final column, enter profit for each quantity.
(Note: If the firm suffers a loss, enter a
negative number in the appropriate cell.)
Quantity
Total Cost
Marginal Cost
Total Revenue
Marginal Revenue
Profit
(Dollars)
(Dollars)
(Dollars)
(Dollars)
(Dollars)
0
6
0
1
8
7
2
10
14
3
13
21
4
17
28
5
24
35
6
32
42
7
42
49
In order to maximize profit, how...
Consider total cost and total revenue, given in the following
table:
In the final column, enter profit for each quantity.
(Note: If the firm suffers a loss, enter a
negative number in the appropriate cell.)
Quantity
Total Cost
Marginal Cost
Total Revenue
Marginal Revenue
Profit
(Dollars)
(Dollars)
(Dollars)
(Dollars)
(Dollars)
0
6
0
1
8
7
2
10
14
3
13
21
4
17
28
5
24
35
6
32
42
7
42
49
In order to maximize profit, how...
3. Problems and Applications Q3 Consider total cost and total revenue, given in the following table:...
 3. Problems and Applications Q3
Consider total cost and total revenue, given in the following
table:
We were unable to transcribe this image10 T Marginal Revenue Marginal Cost Quantity of 6 units The marginal-revenue curve and the marginal-cost curve cross at a quantity , as quantity increases. in a competitive industry, because marginal revenue is This firm is not True or False: The industry is in a long-run equilibrium True O False
3. Problems and Applications Q3
Consider total cost and total revenue, given in the following
table:
We were unable to transcribe this image10 T Marginal Revenue Marginal Cost Quantity of 6 units The marginal-revenue curve and the marginal-cost curve cross at a quantity , as quantity increases. in a competitive industry, because marginal revenue is This firm is not True or False: The industry is in a long-run equilibrium True O False
b) (4 points) Graph demand, marginal revenue, marginal cost and average total cost (ATC) below. Mark...
 b) (4 points) Graph demand, marginal revenue, marginal cost and
average total cost (ATC) below. Mark Q*, P*, ATC* (you’ll have to
calculate it) and the endpoints to all of the curves.
c) (2 points) Given your answers above, explain which curve(s)
will shift in the long run and why.
d) (4 points) Draw the graph that represents this firm in the
long-run. Label the profit-maximizing price and quantity as P* and
Q*, respectively. No numbers are necessary, but be...
b) (4 points) Graph demand, marginal revenue, marginal cost and
average total cost (ATC) below. Mark Q*, P*, ATC* (you’ll have to
calculate it) and the endpoints to all of the curves.
c) (2 points) Given your answers above, explain which curve(s)
will shift in the long run and why.
d) (4 points) Draw the graph that represents this firm in the
long-run. Label the profit-maximizing price and quantity as P* and
Q*, respectively. No numbers are necessary, but be...
Consider total cost and total revenue given in the following: (Quantity/Total Cost/Total Revenue): (0/8/0), (1/9/8), (2/10/16), (3/11/24), (4/13/32), (5/19/40), (6/27/48), (7/37/56) Can you tell whether this firm is in a competitive industry
Consider total cost and total revenue given in the following: (Quantity/Total Cost/Total Revenue): (0/8/0), (1/9/8), (2/10/16), (3/11/24), (4/13/32), (5/19/40), (6/27/48), (7/37/56) Can you tell whether this firm is in a competitive industry? If so, can you tell whether the industry is in a long-run equilibrium? Isn't this firm a competitive industry since the price is equal to the marginal revenue? This is obviously a competitive industry because the average revenue is always the same. But the euqilibrium is not the...
k. The following table shows the revenue and cost information for a firm in a competitive...
 k. The following table shows the revenue and cost information for a firm in a competitive market. a) Fill in the missing information. $Price $Total Revenue Marginal Revenue SMC 80 Quantity 0 5 10 15 20 25 30 $Total Cost 100 600 1,075 1,525 1,925 2,525 3,525 b) Based on this information, what are the firm's fixed costs? How do you know? c) What quantity is the firm's profit maximizing quantity? Explain. d) Graph the total revenue and the total...
9. Problems and Applications Q4 Consider total cost and total revenue, given in the following table:...
9. Problems and Applications Q4 Consider total cost and total revenue, given in the following table: In the final column, enter profit for each quantity. (Note: If the firm suffers a loss, enter a negative number in the appropriate cell.) Quantity Total Cost Marginal Cost Total Revenue Marginal Revenue Profit (Dollars) (Dollars) (Dollars) (Dollars) (Dollars) 0 8 0 1 9 8 2 10 16 3 11 24 4 13 32 5 19 40 6 27 48 7 37 56 In...
In the final column, enter profit for each quantity. (Note: If the firm suffers a loss, enter a negative number in the appropriate cell.)
 In the final column, enter profit for each quantity. (Note: If the firm suffers a loss, enter a negative number in the appropriate cell.) In order to maximize profit, how many units should the firm produce? Check all that apply.4567In the previous table, enter marginal revenue and marginal cost for each quantity.On the following graph, use the green points (triangle symbol) to graph the marginal-revenue curve, then use the orange points (square symbol) to plot the marginal-cost curve. (Note: Be sure...
Total Revenue Marginal Revenue 1) For the following firm in a competitive market, COSTS REVENUES Quantity...
 Total Revenue Marginal Revenue 1) For the following firm in a competitive market, COSTS REVENUES Quantity Total Marginal Quantity Produced Cost Cost Demanded Price SO $80 $50 $80 $102 $80 $157 $80 $217 SSO $285 $80 $365 $80 $462 $80 8 $582 IS $80 a) Fill the column for marginal cost, total revenue and marginal revenue. b) What is interesting about the numbers you find for marginal revenue. c) Based on profit maximization rule that you learned in Chapter 14...
Consider the competitive market for halogen lamps. The following graph shows the marginal cost (MC), average total cost (ATC), and average variable cost (AVC) curves for a typical firm in the industry.
 Consider the competitive market for halogen lamps. The following graph shows the marginal cost (MC), average total cost (ATC), and average variable cost (AVC) curves for a typical firm in the industry. For each price in the following table, use the graph to determine the number of lamps this firm would produce in order to maximize its profit. Assume that when the price is exactly equal to the average variable cost, the firm is indifferent between producing zero lamps and the...
 Consider total cost and total revenue, given in the following
table:
In the final column, enter profit for each quantity.
(Note: If the firm suffers a loss, enter a
negative number in the appropriate cell.)
Quantity
Total Cost
Marginal Cost
Total Revenue
Marginal Revenue
Profit
(Dollars)
(Dollars)
(Dollars)
(Dollars)
(Dollars)
0
6
0
1
8
7
2
10
14
3
13
21
4
17
28
5
24
35
6
32
42
7
42
49
In order to maximize profit, how...
Consider total cost and total revenue, given in the following
table:
In the final column, enter profit for each quantity.
(Note: If the firm suffers a loss, enter a
negative number in the appropriate cell.)
Quantity
Total Cost
Marginal Cost
Total Revenue
Marginal Revenue
Profit
(Dollars)
(Dollars)
(Dollars)
(Dollars)
(Dollars)
0
6
0
1
8
7
2
10
14
3
13
21
4
17
28
5
24
35
6
32
42
7
42
49
In order to maximize profit, how...
 3. Problems and Applications Q3
Consider total cost and total revenue, given in the following
table:
We were unable to transcribe this image10 T Marginal Revenue Marginal Cost Quantity of 6 units The marginal-revenue curve and the marginal-cost curve cross at a quantity , as quantity increases. in a competitive industry, because marginal revenue is This firm is not True or False: The industry is in a long-run equilibrium True O False
3. Problems and Applications Q3
Consider total cost and total revenue, given in the following
table:
We were unable to transcribe this image10 T Marginal Revenue Marginal Cost Quantity of 6 units The marginal-revenue curve and the marginal-cost curve cross at a quantity , as quantity increases. in a competitive industry, because marginal revenue is This firm is not True or False: The industry is in a long-run equilibrium True O False
 b) (4 points) Graph demand, marginal revenue, marginal cost and
average total cost (ATC) below. Mark Q*, P*, ATC* (you’ll have to
calculate it) and the endpoints to all of the curves.
c) (2 points) Given your answers above, explain which curve(s)
will shift in the long run and why.
d) (4 points) Draw the graph that represents this firm in the
long-run. Label the profit-maximizing price and quantity as P* and
Q*, respectively. No numbers are necessary, but be...
b) (4 points) Graph demand, marginal revenue, marginal cost and
average total cost (ATC) below. Mark Q*, P*, ATC* (you’ll have to
calculate it) and the endpoints to all of the curves.
c) (2 points) Given your answers above, explain which curve(s)
will shift in the long run and why.
d) (4 points) Draw the graph that represents this firm in the
long-run. Label the profit-maximizing price and quantity as P* and
Q*, respectively. No numbers are necessary, but be...
 k. The following table shows the revenue and cost information for a firm in a competitive market. a) Fill in the missing information. $Price $Total Revenue Marginal Revenue SMC 80 Quantity 0 5 10 15 20 25 30 $Total Cost 100 600 1,075 1,525 1,925 2,525 3,525 b) Based on this information, what are the firm's fixed costs? How do you know? c) What quantity is the firm's profit maximizing quantity? Explain. d) Graph the total revenue and the total...
 Total Revenue Marginal Revenue 1) For the following firm in a competitive market, COSTS REVENUES Quantity Total Marginal Quantity Produced Cost Cost Demanded Price SO $80 $50 $80 $102 $80 $157 $80 $217 SSO $285 $80 $365 $80 $462 $80 8 $582 IS $80 a) Fill the column for marginal cost, total revenue and marginal revenue. b) What is interesting about the numbers you find for marginal revenue. c) Based on profit maximization rule that you learned in Chapter 14...
Most questions answered within 3 hours.
-
3. Gains from trade
Consider two neighbouring island countries called Euphoria and
Contente. They each have...
asked 54 minutes ago -
A business executive has the option to invest money in two
plans: Plan A guarantees that...
asked 3 hours ago -
Hello, can someone please help me answer this question?
How much heat is absorbed by a...
asked 3 hours ago -
. A marketing researcher conducted a survey of 25 shoppers
randomly selected at the local mall...
asked 3 hours ago -
Create an comprehensive response to the
following:
Antimicrobial agents work on a multitude of microbes (bacteria,...
asked 3 hours ago -
6.13 LAB: Step counter. Section 6.3.
A pedometer treats walking 2,000 steps as walking 1 mile....
asked 3 hours ago -
(14.2) A block of mass m = 10 kg riding on a frictionless
horizontal plane is...
asked 3 hours ago -
Use any search engine to search for articles about Starbucks
partnership with Tata Companies in India...
asked 3 hours ago -
Let’s say that for some reason Bank Excess Reserves suddenly
increase sharply. What effect would this...
asked 3 hours ago -
Given:
Curent Assets: $600,000
Total Assets: $2,600,000
Current Liabilities: $500,000
Total Liabilities: $1,700,000
What is the...
asked 3 hours ago -
1. What is a “Bankster”? What is insider trading? Why is it
illegal?
2. What is...
asked 3 hours ago -
A transverse wave on a cord is given by
D(x,t)=0.18sin(2.7x−61.0t), where Dand x are in m...
asked 3 hours ago