Consider total cost and total revenue given in the following: (Quantity/Total Cost/Total Revenue): (0/8/0), (1/9/8), (2/10/16), (3/11/24), (4/13/32), (5/19/40), (6/27/48), (7/37/56) Can you tell whether this firm is in a competitive industry
(Quantity/Total Cost/Total Revenue):
(0/8/0), (1/9/8), (2/10/16), (3/11/24), (4/13/32), (5/19/40), (6/27/48), (7/37/56)
Can you tell whether this firm is in a competitive industry? If so, can you tell whether the industry is in a long-run equilibrium?
Isn't this firm a competitive industry since the price is equal to the marginal revenue?
This is obviously a competitive industry because the average revenue is always the same. But the euqilibrium is not the long run euilibrium because at the equilibrium average cost and average revevue are not equal to each other.
This is obviously a competitive industry because the average revenue is always the same. But the euqilibrium is not the long run euilibrium because at the equilibrium average cost and average revevue are not equal to each other.
Homework Answers
 a) The firm is indifferent
betwen 5th and 6th quantity of output as the maximum profit it
makes is on 5th and 6th quantity.
a) The firm is indifferent
betwen 5th and 6th quantity of output as the maximum profit it
makes is on 5th and 6th quantity.
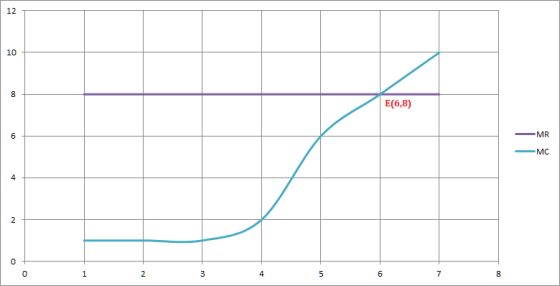
b) The curves crosses each other at 6th quantity of output. By this approach of MC=MR, we can say that the firm should produce 6 units of output.
c) Yes the firm is ina competitive industry as AR is constant through each unit of output. NO, the industry is not in a long-run equilibrium as at 6th unit of output, price is greater than AC.
A)
| Qty. | TC | TR | PROFIT(TR-TC) |
|---|---|---|---|
| 0 | 8 | 0 | -8 |
| 1 | 9 | 8 | -1 |
| 2 | 10 | 16 | 6 |
| 3 | 11 | 24 | 13 |
| 4 | 13 | 32 | 19 |
| 5 | 19 | 40 | 21 |
| 6 | 27 | 48 | 21 |
| 7 | 37 | 56 | 19 |
As observed from the above table, the Firm should produce 6 units to maximize profit. Profit is calculated as TR-TC.
B)
| Qty. | TC | AC | TR | MR | TFC | AFC | TVC | AVC | MC |
| 0 | 8 | - | 0 | - | 8 | - | 0 | - | - |
| 1 | 9 | 9 | 8 | 8 | 8 | 8 | 1 | 1 | 1 |
| 2 | 10 | 5 | 16 | 8 | 8 | 4 | 2 | 1 | 1 |
| 3 | 11 | 3.67 | 24 | 8 | 8 | 2.67 | 3 | 1 | 1 |
| 4 | 13 | 3.25 | 32 | 8 | 8 | 2 | 5 | 1.25 | 2 |
| 5 | 19 | 3.8 | 40 | 8 | 8 | 1.6 | 11 | 2.2 | 6 |
| 6 | 27 | 4.5 | 48 | 8 | 8 | 1.3 | 19 | 3.167 | 8 |
| 7 | 37 | 5.29 | 56 | 8 | 8 | 1.14 | 29 | 4.14 | 10 |
MR=MC when the firm produces 6 units of output. This matches with the answer we found in part A. The graph is at the end of the answer.
C)Yes. this firm is in a competitive industry as the Price is constant and not varying for changing levels of output.
The firm is not operating in the long run as in the long run all
factors of production and costs are variable. The graph for part B.
a. Profit = TR - TC
| Q | TC | TR | Profit = TR-TC |
| 0 | 8 | 0 | -8 |
| 1 | 9 | 8 | -1 |
| 2 | 10 | 16 | 6 |
| 3 | 11 | 24 | 13 |
| 4 | 13 | 32 | 19 |
| 5 | 19 | 40 | 21 |
| 6 | 27 | 48 | 21 |
| 7 | 37 | 56 | 19 |
To maximize profit, the firm must produce either 5 or 6 units.
b. Below are the marginal revenue and marginal costs for each quantity -
Marginal revenue is the additional revenue that the firm earns
when the output is increased by 1 unit.
Marginal cost is the additional cost that the firm incurs when the
output is increased by 1 unit.
| Q | TC | TR | Profit = TR-TC | MR | MC |
| 0 | 8 | 0 | -8 | ||
| 1 | 9 | 8 | -1 | 8 | 1 |
| 2 | 10 | 16 | 6 | 8 | 1 |
| 3 | 11 | 24 | 13 | 8 | 1 |
| 4 | 13 | 32 | 19 | 8 | 2 |
| 5 | 19 | 40 | 21 | 8 | 6 |
| 6 | 27 | 48 | 21 | 8 | 8 |
| 7 | 37 | 56 | 19 | 8 | 10 |
c) Yes, the firm is in competitive industry since its marginal revenue (MR) is constant across all output levels which means that it is a price. It sells all the output at a given price.
No, its not a long run equilibrium position since it is not earning zero economic profits.
Add Answer to:
Consider total cost and total revenue given in the following: (Quantity/Total Cost/Total Revenue): (0/8/0), (1/9/8), (2/10/16), (3/11/24), (4/13/32), (5/19/40), (6/27/48), (7/37/56) Can you tell whether this firm is in a competitive industry
Consider total cost and total revenue given in the table below:
. Consider total cost and total revenue given in the table below:QUANTITY 0 1 2 3 4 5 6 7Total cost $8 $9 $10 $11 $13 $19 $27 $37Total revenue 0 8 16 24 32 40 48 56a. Calculate profit for each quantity. How much should the firm produce to maximize profit?b. Calculate marginal revenue and marginal cost for each quantity. Graph them. (Hint: Put the points between whole numbers. For example, the marginal cost between 2 and 3 should...
Suppose a perfectly competitive, increasing-cost industry is in long-run equilibrium when market demand increases. In the long run, a typical firm _____ a.will stop production as total revenue no long...
Suppose a perfectly competitive, increasing-cost industry is in long-run equilibrium when market demand increases. In the long run, a typical firm _____ a.will stop production as total revenue no longer covers the average variable cost of production. b.experiences the same equilibrium price but a lower average total cost. c.experiences a lower average total cost and equilibrium price. d.experiences the same equilibrium price but a greater average total cost. e.experiences a higher average total cost and equilibrium price.
(Chapters 24 and 16 in the book) Problem 6. Consider a competitive industry in the long...
 (Chapters 24 and 16 in the book) Problem 6. Consider a competitive industry in the long run with many firms, all of which have identical costs functions c(y) - y2 when y> 0, and c(0) 0 when y 0. The marginal cost of each firm is MCy) 2y. Suppose that the initial market demand is D(p) 52 -p Note: The number of firms is always an integer. The output of a firm does not have to be an integer. (a)...
5. Consider total cost and total revenue given in the following table:
 5. Consider total cost and total revenue given in the following table: a. Calculate profit for each quantity. How much should the firm produce to maximize profit? b. Calculate marginal revenue and marginal cost for each quantity. Graph them. (Hint: Put the points between whole numbers. For example, the marginal cost between 2 and 3 should be graphed at 2/½.) c. At what quantity do the curves in part b cross? How does this relate to your answer to part a.? d. Can you...
Consider the competitive market for copper. Assume that, regardless of how many firms are in the industry, every firm in the industry is identical and faces the marginal cost (MC), average total cost (ATC)
 7. Short-run supply and long-run equilibrium Consider the competitive market for copper. Assume that, regardless of how many firms are in the industry, every firm in the industry is identical and faces the marginal cost (MC), average total cost (ATC), and average variable cost (AVC) curves shown on the following graph. The following diagram shows the market demand for copper. Use the orange points (square symbol) to plot the initial short-run industry supply curve when there are 20 firms in the market. (Hint:...
Suppose that a firm produces baseball bats in a monopolistically competitive market. The following graph shows its demand curve, marginal revenue (MR) curve, marginal cost (MC) curve, and average total cost (ATC) curve.
 3. Is monopolistic competition efficient? Suppose that a firm produces baseball bats in a monopolistically competitive market. The following graph shows its demand curve, marginal revenue (MR) curve, marginal cost (MC) curve, and average total cost (ATC) curve. Place a black point (plus symbol) on the graph to indicate the long-run monopolistically competitive equilibrium price and quantity for this firm. Next, place a grey point (star symbol) to indicate the minimum average total cost the firm faces and the quantity associated with...
Consider the competitive market for copper. Assume that, regardless of how many firms are in the industry, every firm in the Industry is identical and faces the marginal cost (MC), average total cost (ATC), and average variable cost (AVC) curves shown on
 6. Short-run supply and long-run equilibrium Consider the competitive market for copper. Assume that, regardless of how many firms are in the industry, every firm in the Industry is identical and faces the marginal cost (MC), average total cost (ATC), and average variable cost (AVC) curves shown on the following graph. The following diagram shows the market demand for copper. Use the orange points (square symbol) to plot the initial short-run industry supply curve when there are 20 firms in the market. (Hint:...
4. Is monopolistic competition efficient? Suppose that a firm produces polo shirts in a monopolistically competitive...
 4. Is monopolistic competition efficient? Suppose that a firm produces polo shirts in a monopolistically competitive market. The following graph shows its demand curve, marginal revenue (MR) curve, marginal cost (MC) curve, and average total cost (ATC) curve. Place a black point (plus symbol) on the graph to indicate the long-run monopolistically competitive equilibrium price and quantity for this firm. Next, place a grey point (star symbol) to indicate the minimum average total cost the firm faces and the quantity...
$40 MC $64 $36 Demand $56 $32 ATC $28 $48 $24 $40 Cost of Webcam $20...
 $40 MC $64 $36 Demand $56 $32 ATC $28 $48 $24 $40 Cost of Webcam $20 Price of Webcam $16 $12 $24 AVC $16 $8 $4 $8 Supply $0 $0 0 1 2 8 9 10 3 4 5 6 7 Quantity of Webcams 0 50 100 150 200 250 300 350 400 450 500 550 600 650 700 Quantity of Webcams Assume the perfectly competitive webcam industry in this question is made up of identical firms. The graph on...
Consider the competitive market for copper. Assume that, regardless of how many firms are in the industry, every firm in the industry is identical and faces the marginal cost (MC), average total cost (ATC), and average variable cost (AVC) curves shown on
 7. Short-run supply and long-run equilibrium Consider the competitive market for copper. Assume that, regardless of how many firms are in the industry, every firm in the industry is identical and faces the marginal cost (MC), average total cost (ATC), and average variable cost (AVC) curves shown on the following graph.The following diagram shows the market demand for copper.Use the orange points (square symbol) to plot the initial short-run industry supply curve when there are 20 firms in the market. (Hint:...
 (Chapters 24 and 16 in the book) Problem 6. Consider a competitive industry in the long run with many firms, all of which have identical costs functions c(y) - y2 when y> 0, and c(0) 0 when y 0. The marginal cost of each firm is MCy) 2y. Suppose that the initial market demand is D(p) 52 -p Note: The number of firms is always an integer. The output of a firm does not have to be an integer. (a)...
 6. Short-run supply and long-run equilibrium Consider the competitive market for copper. Assume that, regardless of how many firms are in the industry, every firm in the Industry is identical and faces the marginal cost (MC), average total cost (ATC), and average variable cost (AVC) curves shown on the following graph. The following diagram shows the market demand for copper. Use the orange points (square symbol) to plot the initial short-run industry supply curve when there are 20 firms in the market. (Hint:...
 4. Is monopolistic competition efficient? Suppose that a firm produces polo shirts in a monopolistically competitive market. The following graph shows its demand curve, marginal revenue (MR) curve, marginal cost (MC) curve, and average total cost (ATC) curve. Place a black point (plus symbol) on the graph to indicate the long-run monopolistically competitive equilibrium price and quantity for this firm. Next, place a grey point (star symbol) to indicate the minimum average total cost the firm faces and the quantity...
 $40 MC $64 $36 Demand $56 $32 ATC $28 $48 $24 $40 Cost of Webcam $20 Price of Webcam $16 $12 $24 AVC $16 $8 $4 $8 Supply $0 $0 0 1 2 8 9 10 3 4 5 6 7 Quantity of Webcams 0 50 100 150 200 250 300 350 400 450 500 550 600 650 700 Quantity of Webcams Assume the perfectly competitive webcam industry in this question is made up of identical firms. The graph on...
Most questions answered within 3 hours.
-
The electric field in the region between two oppositely charged,
parallel, conducting plates has a magnitude...
asked 12 seconds ago -
A small body of mass m performs small oscillations sliding (no
rolling) along the bottom of...
asked 53 seconds ago -
A simple random sample was taken to test the claim that the
population mean is no...
asked 1 hour ago -
A set of length measurements are obtained with the values 165.6
± 0.3, 165.1± 0.4,166.4± 1.0,...
asked 1 hour ago -
1. Which of the following is true about unconscionable
contracts?
a. A term is substantially unconscionable...
asked 14 minutes ago -
A company is interested in estimating the costs of lunch
in their cafeteria. After surveying employees,...
asked 46 minutes ago -
A 0.2m diameter ball with an initial velocity of 8m/s rolls up a
hill without slipping....
asked 29 minutes ago -
I want to redraft the solution, using other words , use your own
words don't copy...
asked 18 minutes ago -
Hyundai Motors is considering threesites—A, B,C —at which to
locate a factory to build its new-model...
asked 20 minutes ago -
Learning Outcomes:
Upon the successful completion of this module, you should
understand the following concepts:
Strategic...
asked 21 minutes ago -
Identify four of the five major types of organizations within
the federal bureaucracy, and give examples...
asked 29 minutes ago -
The following data have been obtained
for the effect of solvent composition on the solubility of...
asked 30 minutes ago