
Homework Answers
Consider the given problem here there are two goods “house riding” and “skiing”. Now, the consumer has “$500” and the price of each of the goods is “$100”, => “A1B1” be the budget line is this case. Consider the following fig.

So, here “X” be the optimum point where “IC” is tangent to “Curve A” and the budget line “A1B1”. So, here optimum consumption choice is given by “X=3, Y=2”. Now, here the indifference curve “A” is tangent to the budget line, => “MRS = price ratio = 100/100 = 1”, => at the optimum “MRS = 1”.
Now, let’s assume that the price “house riding” increases to “150”, => the budget line get steeper, => the new budget line is given by “A1B2” with absolute slope “150/100 = 1.5”. Now, the new equilibrium point is given by “T” the tangency point between “A1B2” and the indifference curve “C”. So, here the optimum consumption is given by “X=2, Y=2”. So, here the price of “house riding” increases implied the consumption of it decreases to “2”.
Consider the following of the demand for “horse riding”.
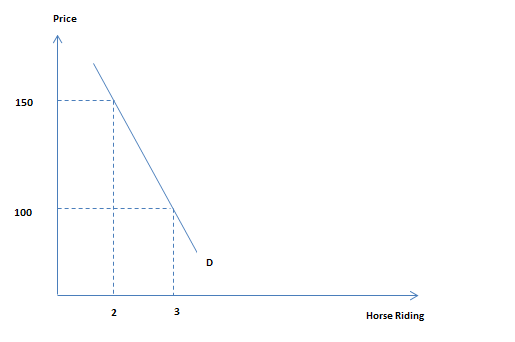
So, here there two pints “E1” where “P=100, X=3” and “E2” where “P=150, X=2”. So, here the demand curve is downward sloping.
Now, to decompose the “total effect of price change” into “SE” and “IE”, we have to draw a budget line parallel to”A1B2” but is tangent to the indifference curve “A”. So, here the equilibrium point is “C”. So, here the movement from “T” to “C” shows the “SE” and the movement from “C” to “X” shows the “IE”.
Now, if we draw another budget line “A3B4” which parallel to “A2B3”, => the new budget line shows the higher level of income compare to “A2B3”. So, here the optimum consumption bundle is given by “D”. So, here point “D” shows lower of “X” compare to “C”, => the consumption of “X” decreases for a sufficiently larger level of income, => “horse riding become inferior” for larger level of income.
Add Answer to:
Jane's income is $500 a semester. The price of one day of
skiing per semester is...
Days of skiing per semester Curve B Y Curve A Curve C 0 1 2 3 4 5 6 7 Days of horseback riding per semester If good ski...
 Days of skiing per semester Curve B Y Curve A Curve C 0 1 2 3 4 5 6 7 Days of horseback riding per semester If good skiing costs $100 per day and horseback riding costs $50 per day, if you have $250 to spend how many days of skiing could you do 2 days 3 days O days
In the following diagram, we show one of Jane's indifference curves and her budget line a. If the price of good...
 In the following diagram, we show one of Jane's indifference curves and her budget line a. If the price of good X is $100, what is her income? b. What is the equation for her budget line? c. What is the slope of her budget line? d. What is the price of good Y? e. What is Jane's marginal rate of substitution in cquilibrium? 8. Good X 40 80 0 Good Y
In the following diagram, we show one of...
In the following diagram, we show one of Jane's indifference curves and her budget line a. If the price of good X is $100, what is her income? b. What is the equation for her budget line? c. What is the slope of her budget line? d. What is the price of good Y? e. What is Jane's marginal rate of substitution in cquilibrium? 8. Good X 40 80 0 Good Y
In the following diagram, we show one of...
The demand curve for potatoes is downward sloping. If the price of potatoes, an inferior good,...
 The demand curve for potatoes is downward sloping. If the price of potatoes, an inferior good, rises, then a. both the income and substitution effects reinforce each other to decrease the quantity demanded. b. the income and substitution effects offset each other but the price effect of an inferior good leads you to buy more potatoes. c. the income effect (which causes you to reduce your potato purchases) is smaller than the substitution effect (which causes you to increase your...
36) What would happen in the red apple market if the price of golden apples decreases?...
 36) What would happen in the red apple market if the price of golden apples decreases? 36) A) The demand for red apples would increase B) The quantity demanded of red apples would increase C) The demand for red apples would fall. D) Nothing, they are separate and unrelated commodities. 37) Market demand shows: 37) A) the quantity of a good that one seller will sell at a given price B) the quantity of a good that one buyer will...
One week, the quantity of pizza consumed is 35 slices per day at a price of...
One week, the quantity of pizza consumed is 35 slices per day at a price of $2.00 per slice. The next week, the price of pizza rises to $2.50 per slice, but the quantity consumed falls to 5 slices per day. Calculate the price elasticity of demand. Is demand for pizza elastic or inelastic? A car company hires economists to calculate the price elasticity of demand for their most popular brand. They find that the PED is .01. If the...
Exercise 4.1: Price Elasticity of Demand The price of a good is $200, and the quantity...
 Exercise 4.1: Price Elasticity of Demand The price of a good is $200, and the quantity demanded is 2,000. The price elasticity of demand is-1.25. If the price changes to $204, what is the new quantity demanded? Exercise 4.2: Income Elasticity of Demand A consumer's income is $40,000, and the quantity demanded of a good is 2,000. The income elasticity of demand is +0.60. If the consumer's income changes to $41,000, what is the new quantity demanded? Exercise 4.3: Income...
Qp-8000-2Px+0.41-2Py+5Pz Where OD quantity demanded of good X Px price of good X Iconsumer income, in...
 Qp-8000-2Px+0.41-2Py+5Pz Where OD quantity demanded of good X Px price of good X Iconsumer income, in thousands Py price of good Y Pz price of good Z a. Based on the demand curve above, is X a normal or an inferior good? b. Based on the demand curve above, what is the relationahip between good X and good Y? c. Based on the demand ourve above, what is the relationship between good X and good Z7 d. What is the...
Suppose the price of one good increases. What is the substitution and the income effect of this price change? What else...
Suppose the price of one good increases. What is the substitution and the income effect of this price change? What else do you need to know to fully answer this?
19. How many days of labor should the firm hire if the wage is $30/day of...
 19. How many days of labor should the firm hire if the wage is $30/day of labor? 0 1 2 3 4 5 6 7 Can't tell 20. How many days of labor should the firm hire if the wage is $10/day of labor? 0 1 2 3 4 5 6 7 Can't tell 21. How many days of labor should the firm hire if the wage is $0/day of labor? 0 1 2 3 4 5 6 7 Can't...
A consumer has the demand function x* = x1(P1, m). When the price of good one...
 A consumer has the demand function x* = x1(P1, m). When the price of good one decreases, we observe a substitution effect of -3.9 and an income effect of 1. What can we say about good 1?
 Days of skiing per semester Curve B Y Curve A Curve C 0 1 2 3 4 5 6 7 Days of horseback riding per semester If good skiing costs $100 per day and horseback riding costs $50 per day, if you have $250 to spend how many days of skiing could you do 2 days 3 days O days
 In the following diagram, we show one of Jane's indifference curves and her budget line a. If the price of good X is $100, what is her income? b. What is the equation for her budget line? c. What is the slope of her budget line? d. What is the price of good Y? e. What is Jane's marginal rate of substitution in cquilibrium? 8. Good X 40 80 0 Good Y
In the following diagram, we show one of...
In the following diagram, we show one of Jane's indifference curves and her budget line a. If the price of good X is $100, what is her income? b. What is the equation for her budget line? c. What is the slope of her budget line? d. What is the price of good Y? e. What is Jane's marginal rate of substitution in cquilibrium? 8. Good X 40 80 0 Good Y
In the following diagram, we show one of...
 The demand curve for potatoes is downward sloping. If the price of potatoes, an inferior good, rises, then a. both the income and substitution effects reinforce each other to decrease the quantity demanded. b. the income and substitution effects offset each other but the price effect of an inferior good leads you to buy more potatoes. c. the income effect (which causes you to reduce your potato purchases) is smaller than the substitution effect (which causes you to increase your...
 36) What would happen in the red apple market if the price of golden apples decreases? 36) A) The demand for red apples would increase B) The quantity demanded of red apples would increase C) The demand for red apples would fall. D) Nothing, they are separate and unrelated commodities. 37) Market demand shows: 37) A) the quantity of a good that one seller will sell at a given price B) the quantity of a good that one buyer will...
 Exercise 4.1: Price Elasticity of Demand The price of a good is $200, and the quantity demanded is 2,000. The price elasticity of demand is-1.25. If the price changes to $204, what is the new quantity demanded? Exercise 4.2: Income Elasticity of Demand A consumer's income is $40,000, and the quantity demanded of a good is 2,000. The income elasticity of demand is +0.60. If the consumer's income changes to $41,000, what is the new quantity demanded? Exercise 4.3: Income...
 Qp-8000-2Px+0.41-2Py+5Pz Where OD quantity demanded of good X Px price of good X Iconsumer income, in thousands Py price of good Y Pz price of good Z a. Based on the demand curve above, is X a normal or an inferior good? b. Based on the demand curve above, what is the relationahip between good X and good Y? c. Based on the demand ourve above, what is the relationship between good X and good Z7 d. What is the...
 19. How many days of labor should the firm hire if the wage is $30/day of labor? 0 1 2 3 4 5 6 7 Can't tell 20. How many days of labor should the firm hire if the wage is $10/day of labor? 0 1 2 3 4 5 6 7 Can't tell 21. How many days of labor should the firm hire if the wage is $0/day of labor? 0 1 2 3 4 5 6 7 Can't...
 A consumer has the demand function x* = x1(P1, m). When the price of good one decreases, we observe a substitution effect of -3.9 and an income effect of 1. What can we say about good 1?
Most questions answered within 3 hours.
-
In winter a lake has a 0.35 m thick ice layer over 1.10 m of
water....
asked 6 minutes ago -
Assuming the following has been encrypted with a Vigenere cipher
below, use the method(s) and assumptions...
asked 32 minutes ago -
How would I use switch statements to write a program that will
take an input of...
asked 22 minutes ago -
Imagine a reaction in which methane gas combusts at a constant
pressure of 1 atm and...
asked 33 minutes ago -
Two parallel wires (each 12 m in length) are separated by a
distance of 0.065 m...
asked 31 minutes ago -
Suppose there were three masses at the corner of uniform
equilateral triangle. The masses are m1...
asked 33 minutes ago -
Situation: A building that is 618 m above the ground floor. How
many times would a...
asked 36 minutes ago -
help me and discuss one successful and one
unsuccessful international company/busines in Indonesia.whyit
succeed and why...
asked 44 minutes ago -
I- Choose the best answer
Which of the following statements about the structure and
packaging of...
asked 45 minutes ago -
1. A sample of 144 incoming freshman found that 45 of them
scored more than 550...
asked 52 minutes ago -
Kc is 2.35 × 10¹⁸ at 25 °C for the formation of iron(III)
oxalate complex ion....
asked 53 minutes ago -
Team Values – Discuss as a team what values are important.
Develop a statement or itemised...
asked 1 hour ago