
![/quiz?ctx-gmcdonne-00748quiz action-takeQuiz&quiz probGuid action-takeQuiz&quiz probGuid-ONAPCOA80 10100000048896fe00700008ck-m 154854980287 accordingly. PRICE [Dollars per barrel) EQUILIBRIUM CALCULATOR MARKET FOR HEATING OIL Price of Heating OIl Dollers per barrel Quantity Demanded Thousands of barrels/dayl Shortage B0 70 60 50 40 30 20 10 30 Quantity Supplied Thousands of barrels/dayl 60 40 Surplus ITheusands of barrels/deyl Thousands of barrels/day DEMAND SHIFTERS SUPPLY SHIFTERS Cost of Crude Oil Price of an Oil Furnace 2000 Cost of Refining O Price of Natural Gas 1 25 (Dollars per 1,000 cubic ft) [Dollars per furnace) Average Annual Income Per barral of heating oil Per barrel of heating oil] 「 40 + -i-← | Thousands of dollars 0 20 40 60 80 100 120 140 160 QUANTITY IThousands of barrels) Suppose that all of the determinants of supply and demand for heating oll are equal to their initial values. (If youve changed any of them, click the Reset to Initial Values button.) The equilibrium quantity in this market is barrels of heating oil per day, and the equilibrium price is per barrel. Suppose that the cost of crude oil Increases from $25 to $55 for each barrel of heating oil produced. Assuming that the rest of the determinants of supply and demand for heating oil remain equal to their initial values, the market will eventually reach a new equilibrium price ofM oil increases by $30, the price of heating oil increases by per barrel. While the cost of producing each barrel of heating per barrel. Reset the calculator to its initial values. Suppose that instead of an increase in the cost of producing heating oil, there was an increase in the price of natural gas from $10 to $20 per 1,000 cubic feet. If the price of heating oil were to remain at the initial equilibrium price you found in the first question, there would be of barrels of heating oil per day, which would exert pressure on prices](http://img.homeworklib.com/questions/aee75e70-6e55-11ea-8822-6d0489459d8d.png?x-oss-process=image/resize,w_560)
Homework Answers
1) 80 thousand
2) $40 is the equilibrium price because demand curve intersects supply curve at this price.
3) Increase in cost of crude oil increases the cost of production of good and thus decreases supply. Decrease in supply shifts supply curve leftwards causing equilibrium price = $ 55
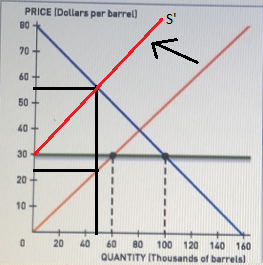
4) Equilibrium price increases by 55 - 40 = $ 15
5) Price of natural gas is the substitute good for heating oil.
Increase in the price of natural gas increases the demand of heating oil as people substitute natural gas for heating oil. This shifts demand curve rightwards causing increase in equilibrium price and equilibrium quantity.
More demand of heating oil. Upward pressure on price.
Add Answer to:
4. Understanding changes In equillbrium price and quantity Aa Aa Suppose you are an analyst in...
3. Understanding changes in equilibrium price and quantity Suppose you are an analyst in the oil...
 3. Understanding changes in equilibrium price and quantity Suppose you are an analyst in the oil refinery industry and are responsible for estimating the equilibrium price and quantity of home heating oil. To do so, you must consider factors that can affect the supply of and demand for heating oil. Determinants of the demand for heating oil include household income, the price of an oil furnace (a complementary good for heating oil), and the price of natural gas (a substitute...
30 Price or eating Oil (Dollars per barrel) Quantity Demanded (Thousands of barrels per day) 100...
 30 Price or eating Oil (Dollars per barrel) Quantity Demanded (Thousands of barrels per day) 100 60 Quantity Supplied (Thousands of barrels per day) PRICE (Dollars per barrel) Demand Shifters Supply Shifters Gas Cost of Crude Oil (Per barrel of heating on Price of Natural (Dollars per 1,000 cubicit) Price of an Oil Furnace (Dollars per furnace) Average Annual Income (Thousands of dollars) 2000 Cost of Refining of (Per barrel of heating oil) 20 40 60 80 100 120 140...
EQUILIBRIUM CALCULATOR: MARKET FOR HEATING OIL PRICE (Dollars per barrel] 80 Price of Heating Oil 30...
 EQUILIBRIUM CALCULATOR: MARKET FOR HEATING OIL PRICE (Dollars per barrel] 80 Price of Heating Oil 30 Dollars per barrel) Quantity Demanded Thousands of barrels/day] Shortage 70 100 Quantity Supplied 60 60 Thousands of barrels/day) 50 40 Surplus Thousands of barrels/day) Thousands of barrels/day) 40 DEMAND SHIFTERS SUPPLY SHIFTERS 30 Price of Natural Gas [Dollars per 1,000 cubic ft.] Cost of Crude Oil Per barrel of heating oil] 10 25 20 Price of an Oil Furnace [Dollars per furnace] Cost of...
12.10. Suppose that the total market demand for crude oil is given by Qp70,000 - 2,000...
 12.10. Suppose that the total market demand for crude oil is given by Qp70,000 - 2,000 P, where Qp is the quantity of oil in thousands of barrels per year and P is the dollar price per barrel. Suppose also that there are 1,000 identical small producers of crude oil, each with marginal costs given by MC = q+5, where q is the output of the typical firm a. Assuming that each small oil producer acts as a price taker,...
Suppose that a country imports 2 billion barrels of crude oil per year and domestically produces...
Suppose that a country imports 2 billion barrels of crude oil per year and domestically produces another 4 billion barrels of crude oil per year. All the domestic production is consumed by domestic consumers (i.e. there are no exportations). The world price of crude oil is $80 per barrel. Assuming linear demand and supply schedules, economists estimate the price elasticity of domestic supply to be 0.3 and the price elasticity of domestic demand to be -0.15 at the current equilibrium....
Please help me with my Econ homework? Suppose that the world price of oil is $80...
 Please help me with my Econ homework?
Suppose that the world price of oil is $80 per barrel and that the United States can buy all the oil it wants at this price. Suppose also that the demand and supply schedules for oil in the United States are as follows 9. Market for Crude Oil U.S. Quantity U.S. Quantity ($ per Barrel) Demanded 26 24 Supplied 60 65 70 75 16 18 20 18 1.) Using the mutipoint curve drawing...
Please help me with my Econ homework?
Suppose that the world price of oil is $80 per barrel and that the United States can buy all the oil it wants at this price. Suppose also that the demand and supply schedules for oil in the United States are as follows 9. Market for Crude Oil U.S. Quantity U.S. Quantity ($ per Barrel) Demanded 26 24 Supplied 60 65 70 75 16 18 20 18 1.) Using the mutipoint curve drawing...
please anwser all questions. thank you so much! Aa Aa Undershaft Industries is a monopsonist. The following graph shows the labor supply curve it faces (labeled "S"), its marginal reven...
 please anwser all questions. thank you so much!
Aa Aa Undershaft Industries is a monopsonist. The following graph shows the labor supply curve it faces (labeled "S"), its marginal revenue product curve (labeled "MRP"), and its marginal rèsource cośt curve (labeled MRC). WAGE (Dollars per hour 50 MR 40 MRP 30 20 10 10 20 30 40 QUANTITY OF LABOR INumber of werkersl Undershaft faces an upward-sloping above its labor supply curve. labor supply curve. Therefore, its marginal resource cost...
please anwser all questions. thank you so much!
Aa Aa Undershaft Industries is a monopsonist. The following graph shows the labor supply curve it faces (labeled "S"), its marginal revenue product curve (labeled "MRP"), and its marginal rèsource cośt curve (labeled MRC). WAGE (Dollars per hour 50 MR 40 MRP 30 20 10 10 20 30 40 QUANTITY OF LABOR INumber of werkersl Undershaft faces an upward-sloping above its labor supply curve. labor supply curve. Therefore, its marginal resource cost...
Please help me with my economics homework? 10. Suppose that the world price of oilis $70...
 Please help me with my economics homework?
10. Suppose that the world price of oilis $70 per barrel and that the United States can buy all the oil it wants at this price. Suppose also schedules for oil in the United States are as follows U.S. Quantity Demanded 26 24 U.S. Quantity Supplied 14 16 18 20 ($ per Barrel) 60 65 70 75 20 18 Now suppose that the United States allows no oil imports. The equilibrium price in...
Please help me with my economics homework?
10. Suppose that the world price of oilis $70 per barrel and that the United States can buy all the oil it wants at this price. Suppose also schedules for oil in the United States are as follows U.S. Quantity Demanded 26 24 U.S. Quantity Supplied 14 16 18 20 ($ per Barrel) 60 65 70 75 20 18 Now suppose that the United States allows no oil imports. The equilibrium price in...
7. Suppose that you have been hired as an economist by OPEC and given the following...
 7. Suppose that you have been hired as an economist by OPEC and given the following schedule showing the world demand for oil:Your advice is needed on the following Price(S/barrel) Quantity demanded(millions of barrels/day) 10 20 30 40 50 60 50 40 30 20 questions: a) If the price rises from $20 to $30 a barrel, will the total revenue from oil sales increase or decrease? b) What will happen to total revenue if the supply of oil is decreased...
Price (cents per gallon) 90 100 110 120 130 140 150 Quantity Demanded (thousand gallons per...
 Price (cents per gallon) 90 100 110 120 130 140 150 Quantity Demanded (thousand gallons per week 80 70 60 50 40 30 20 Quantity Supplied (thousand gallons per week 20 30 40 50 60 70 80 A market research team has come up with the demand and supply schedules for gasoline in Motorville in the table above. Use these data to analyze the situation in the market for gas in Motorville a) Draw a figure showing the demand curve...
 3. Understanding changes in equilibrium price and quantity Suppose you are an analyst in the oil refinery industry and are responsible for estimating the equilibrium price and quantity of home heating oil. To do so, you must consider factors that can affect the supply of and demand for heating oil. Determinants of the demand for heating oil include household income, the price of an oil furnace (a complementary good for heating oil), and the price of natural gas (a substitute...
 30 Price or eating Oil (Dollars per barrel) Quantity Demanded (Thousands of barrels per day) 100 60 Quantity Supplied (Thousands of barrels per day) PRICE (Dollars per barrel) Demand Shifters Supply Shifters Gas Cost of Crude Oil (Per barrel of heating on Price of Natural (Dollars per 1,000 cubicit) Price of an Oil Furnace (Dollars per furnace) Average Annual Income (Thousands of dollars) 2000 Cost of Refining of (Per barrel of heating oil) 20 40 60 80 100 120 140...
 EQUILIBRIUM CALCULATOR: MARKET FOR HEATING OIL PRICE (Dollars per barrel] 80 Price of Heating Oil 30 Dollars per barrel) Quantity Demanded Thousands of barrels/day] Shortage 70 100 Quantity Supplied 60 60 Thousands of barrels/day) 50 40 Surplus Thousands of barrels/day) Thousands of barrels/day) 40 DEMAND SHIFTERS SUPPLY SHIFTERS 30 Price of Natural Gas [Dollars per 1,000 cubic ft.] Cost of Crude Oil Per barrel of heating oil] 10 25 20 Price of an Oil Furnace [Dollars per furnace] Cost of...
 12.10. Suppose that the total market demand for crude oil is given by Qp70,000 - 2,000 P, where Qp is the quantity of oil in thousands of barrels per year and P is the dollar price per barrel. Suppose also that there are 1,000 identical small producers of crude oil, each with marginal costs given by MC = q+5, where q is the output of the typical firm a. Assuming that each small oil producer acts as a price taker,...
 Please help me with my Econ homework?
Suppose that the world price of oil is $80 per barrel and that the United States can buy all the oil it wants at this price. Suppose also that the demand and supply schedules for oil in the United States are as follows 9. Market for Crude Oil U.S. Quantity U.S. Quantity ($ per Barrel) Demanded 26 24 Supplied 60 65 70 75 16 18 20 18 1.) Using the mutipoint curve drawing...
Please help me with my Econ homework?
Suppose that the world price of oil is $80 per barrel and that the United States can buy all the oil it wants at this price. Suppose also that the demand and supply schedules for oil in the United States are as follows 9. Market for Crude Oil U.S. Quantity U.S. Quantity ($ per Barrel) Demanded 26 24 Supplied 60 65 70 75 16 18 20 18 1.) Using the mutipoint curve drawing...
 please anwser all questions. thank you so much!
Aa Aa Undershaft Industries is a monopsonist. The following graph shows the labor supply curve it faces (labeled "S"), its marginal revenue product curve (labeled "MRP"), and its marginal rèsource cośt curve (labeled MRC). WAGE (Dollars per hour 50 MR 40 MRP 30 20 10 10 20 30 40 QUANTITY OF LABOR INumber of werkersl Undershaft faces an upward-sloping above its labor supply curve. labor supply curve. Therefore, its marginal resource cost...
please anwser all questions. thank you so much!
Aa Aa Undershaft Industries is a monopsonist. The following graph shows the labor supply curve it faces (labeled "S"), its marginal revenue product curve (labeled "MRP"), and its marginal rèsource cośt curve (labeled MRC). WAGE (Dollars per hour 50 MR 40 MRP 30 20 10 10 20 30 40 QUANTITY OF LABOR INumber of werkersl Undershaft faces an upward-sloping above its labor supply curve. labor supply curve. Therefore, its marginal resource cost...
 Please help me with my economics homework?
10. Suppose that the world price of oilis $70 per barrel and that the United States can buy all the oil it wants at this price. Suppose also schedules for oil in the United States are as follows U.S. Quantity Demanded 26 24 U.S. Quantity Supplied 14 16 18 20 ($ per Barrel) 60 65 70 75 20 18 Now suppose that the United States allows no oil imports. The equilibrium price in...
Please help me with my economics homework?
10. Suppose that the world price of oilis $70 per barrel and that the United States can buy all the oil it wants at this price. Suppose also schedules for oil in the United States are as follows U.S. Quantity Demanded 26 24 U.S. Quantity Supplied 14 16 18 20 ($ per Barrel) 60 65 70 75 20 18 Now suppose that the United States allows no oil imports. The equilibrium price in...
 7. Suppose that you have been hired as an economist by OPEC and given the following schedule showing the world demand for oil:Your advice is needed on the following Price(S/barrel) Quantity demanded(millions of barrels/day) 10 20 30 40 50 60 50 40 30 20 questions: a) If the price rises from $20 to $30 a barrel, will the total revenue from oil sales increase or decrease? b) What will happen to total revenue if the supply of oil is decreased...
 Price (cents per gallon) 90 100 110 120 130 140 150 Quantity Demanded (thousand gallons per week 80 70 60 50 40 30 20 Quantity Supplied (thousand gallons per week 20 30 40 50 60 70 80 A market research team has come up with the demand and supply schedules for gasoline in Motorville in the table above. Use these data to analyze the situation in the market for gas in Motorville a) Draw a figure showing the demand curve...
Most questions answered within 3 hours.
-
Which of the following pairs of ions have the same electron
configuration?
I: Br− and Se2−...
asked 29 minutes ago -
The Foremost Composite Materials Company is planning a two-day
sales conference for October 19-20. The conference...
asked 51 minutes ago -
3) Illustrate the observed pattern of relatedness of organisms
versus adaptations to specific conditions. This means...
asked 1 hour ago -
In winter a lake has a 0.35 m thick ice layer over 1.10 m of
water....
asked 2 hours ago -
Assuming the following has been encrypted with a Vigenere cipher
below, use the method(s) and assumptions...
asked 2 hours ago -
How would I use switch statements to write a program that will
take an input of...
asked 2 hours ago -
Imagine a reaction in which methane gas combusts at a constant
pressure of 1 atm and...
asked 2 hours ago -
Two parallel wires (each 12 m in length) are separated by a
distance of 0.065 m...
asked 2 hours ago -
Suppose there were three masses at the corner of uniform
equilateral triangle. The masses are m1...
asked 2 hours ago -
Situation: A building that is 618 m above the ground floor. How
many times would a...
asked 2 hours ago -
help me and discuss one successful and one
unsuccessful international company/busines in Indonesia.whyit
succeed and why...
asked 2 hours ago -
I- Choose the best answer
Which of the following statements about the structure and
packaging of...
asked 2 hours ago