
Please use SAS to solve and show the code thank you.
Homework Answers
a)
H0 : μ1 = μ2 = μ3
H1 : at least one mean is different
| Source | DF | Sum of squares | Mean square | F-vale | Pr >F |
| Model | 2 | 543.6000000 | 271.8000000 | 16.08 | 0.0004 |
| Error | 12 | 202.8000000 | 16.9000000 | ||
| Corrected total | 14 | 746.4000000 |
From the SAS output above, the calculated F statistic is F=16.08
with 2 and 12 degrees of freedoms. The corresponding P-value is
0.0004 which is less than = 0.01, so there
is at least one circuit type that is different.

As per HomeworkLib policy we need to solve four sub parts per question. Please post the remaining questions in another post.
Add Answer to:
Please use SAS to solve and show the code thank
you.
3.22. The response time in...
3.22. The response time in milliseconds was determined for three different types of circuits that could...
 3.22. The response time in milliseconds was determined for three different types of circuits that could be used in an auto- matic valve shutoff mechanism. The results from a complete ly randomized experiment are shown in the following table: Circuit Type 12 21 Response Time 10 23 15 30 20 17 16 (c) Use the graphical procedure in Section 3.5.3 to com- pare the treatment means. What conclusions can you draw? How do they compare with the conclusions from part...
The response time in milliseconds was determined for three different types of circuits that could be...
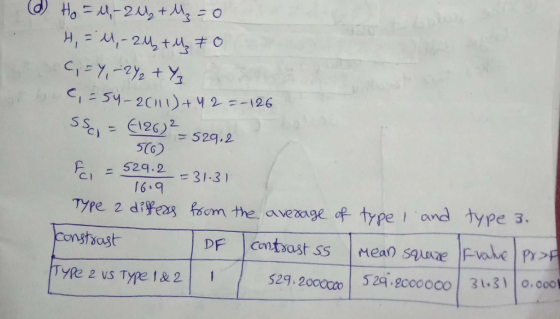
The response time in milliseconds was determined for three different types of circuits that could be used in an automatic valve shutoff mechanism. The results are shown in the following table. Circuit Type Response Time 1 9 12 10 9 15 2 25 26 21 27 29 3 6 7 8 6 7 Test the hypothesis that the three circuit types have the same response time. Use a = 0.01. State the hypotheses, What is the value of the test...
How to solve the question by using SAS?Could you please give me copies of relevant SAS...
 How to solve the question by using SAS?Could you please
give me copies of relevant SAS output?Thanks!
3.16. An experiment was run to determine whether four specific firing temperatures affect the density of a certain type of brick. A completely randomized experiment led to the fol- lowing data: emperature Density 100 125 150 175 21.821.921.7 21.721.4 21.5 21.921.821.821.621.5 21.921.721.8 21.4 21.6 21.7 21.4 (a) Does the firing temperature affect the density of the bricks? Use a - 0.05 (b) Is...
How to solve the question by using SAS?Could you please
give me copies of relevant SAS output?Thanks!
3.16. An experiment was run to determine whether four specific firing temperatures affect the density of a certain type of brick. A completely randomized experiment led to the fol- lowing data: emperature Density 100 125 150 175 21.821.921.7 21.721.4 21.5 21.921.821.821.621.5 21.921.721.8 21.4 21.6 21.7 21.4 (a) Does the firing temperature affect the density of the bricks? Use a - 0.05 (b) Is...
Please use SAS to solve and show the code thank you. 3.26. Three brands of batteries...
 Please use SAS to solve and show the code thank
you.
3.26. Three brands of batteries are under study. It is suspect- ed that the lives (in weeks) of the three brands are different. Five randomly selected batteries of each brand are tested with the following results: Weeks of Life Brand 1 Brand 2 Brand 3 100 96 92 96 92 76 80 75 84 82 108 100 96 98 100 We were unable to transcribe this image
Please use SAS to solve and show the code thank
you.
3.26. Three brands of batteries are under study. It is suspect- ed that the lives (in weeks) of the three brands are different. Five randomly selected batteries of each brand are tested with the following results: Weeks of Life Brand 1 Brand 2 Brand 3 100 96 92 96 92 76 80 75 84 82 108 100 96 98 100 We were unable to transcribe this image
3. Reaction time experiment (L. Cai, T. Li, Nishant, and A. van der Kouwe, 1996) The...
 3. Reaction time experiment (L. Cai, T. Li, Nishant, and A. van der Kouwe, 1996) The experiment was run to compare the effects of auditory and visual cues on speed of response of a human subject. A personal computer was used to present a "stimulus" to a subject, and the reaction time required for the subject to press a key was monitored. The subject was warned that the stimulus was forthcoming by means of an auditory or a visual cue....
*Please perform all calculations by hand or using Minitab. Thank you.* our different designs for a...
 *Please perform all calculations by hand or using
Minitab. Thank you.*
our different designs for a digital computer circuit are being studied to compare the amount of noise present. The following data have been obtained: Circuit Design Noise Observed 47 80 95 19 35 61 80 97 73 83 19 2 78 30 20 4 a) Is the same amount of noise present for all four designs? Use α 0.05. b) Analyze the residuals from this experiment. Are the analysis...
*Please perform all calculations by hand or using
Minitab. Thank you.*
our different designs for a digital computer circuit are being studied to compare the amount of noise present. The following data have been obtained: Circuit Design Noise Observed 47 80 95 19 35 61 80 97 73 83 19 2 78 30 20 4 a) Is the same amount of noise present for all four designs? Use α 0.05. b) Analyze the residuals from this experiment. Are the analysis...
Can you please do part (c) in Rstudio and show me your code? Thank you! 3.10. A product developer is investigating the tensile strength of a new synthetic fiber that wl be used to make cloth for men&...
 Can you please do part (c) in
Rstudio and show me your code? Thank you!
3.10. A product developer is investigating the tensile strength of a new synthetic fiber that wl be used to make cloth for men's shirts. Strength is usually affected by the percentage of cotton used in the blend of materials for the fiber. The engineer conducts a completely randomized experiment with five levels of cotton content and replicates the experiment five times. The data are shown...
Can you please do part (c) in
Rstudio and show me your code? Thank you!
3.10. A product developer is investigating the tensile strength of a new synthetic fiber that wl be used to make cloth for men's shirts. Strength is usually affected by the percentage of cotton used in the blend of materials for the fiber. The engineer conducts a completely randomized experiment with five levels of cotton content and replicates the experiment five times. The data are shown...
Can you please solve number 6 and number 1. Please explain clearly. Thank you. Fill in...
 Can you please solve number 6 and number 1. Please explain
clearly. Thank you.
Fill in the table below with the data you collected during Experiment 2. Fill in the following table with the percentage of each type of kennel. According to your results in Experiment 2, what would be the correct hypothesis to test to see if the traits were inherited through genetics? Record this answer for use in a later question. The hypothesis is null hypothesis. For the...
Can you please solve number 6 and number 1. Please explain
clearly. Thank you.
Fill in the table below with the data you collected during Experiment 2. Fill in the following table with the percentage of each type of kennel. According to your results in Experiment 2, what would be the correct hypothesis to test to see if the traits were inherited through genetics? Record this answer for use in a later question. The hypothesis is null hypothesis. For the...
Use Excel, and show code for how to calculate. Thank You 5.1 Consider the following response...
 Use Excel, and show code for how to calculate. Thank You
5.1 Consider the following response time data measured in seconds.* 1.49 1.70 1.61 1.43 1.29 1.36 1.66 1.42 1.56 1.25 1.80 1.51 1.50 1.44 1.35 1.58 1.31 1.32 1.48 1.47 1.29 1.46 1.62 1.48 1.48 1.34 1.59 1.66 1.55 1.61 1.52 1.80 1.64 1.46 1.38 1.56 1.62 1.30 1.56 1.27 1.37 1.46 1.42 1.59 1.58 1.60 1.67 1.37 1.55 1.55 1.57 1.66 1.38 1.49 1.58 1.48 1.30 1.68 1.65...
Use Excel, and show code for how to calculate. Thank You
5.1 Consider the following response time data measured in seconds.* 1.49 1.70 1.61 1.43 1.29 1.36 1.66 1.42 1.56 1.25 1.80 1.51 1.50 1.44 1.35 1.58 1.31 1.32 1.48 1.47 1.29 1.46 1.62 1.48 1.48 1.34 1.59 1.66 1.55 1.61 1.52 1.80 1.64 1.46 1.38 1.56 1.62 1.30 1.56 1.27 1.37 1.46 1.42 1.59 1.58 1.60 1.67 1.37 1.55 1.55 1.57 1.66 1.38 1.49 1.58 1.48 1.30 1.68 1.65...
Please show formulas you use, it isn't multiple questions only 1. Teacher likes to break the...
 Please show formulas you use, it isn't multiple
questions only 1. Teacher likes to break the question into multiple
parts to help students with the steps. Thank you :)!
5. Perform a hypothesis test to determine if a difference exists in the proportion of uninsured drivers between the states of Mississippi and Tennessee. A random sample of 150 drivers from Mississippi found that 42 were uninsured. A random sample of 125 drivers from Tennessee found that 23 were uninsured. Define...
Please show formulas you use, it isn't multiple
questions only 1. Teacher likes to break the question into multiple
parts to help students with the steps. Thank you :)!
5. Perform a hypothesis test to determine if a difference exists in the proportion of uninsured drivers between the states of Mississippi and Tennessee. A random sample of 150 drivers from Mississippi found that 42 were uninsured. A random sample of 125 drivers from Tennessee found that 23 were uninsured. Define...
 3.22. The response time in milliseconds was determined for three different types of circuits that could be used in an auto- matic valve shutoff mechanism. The results from a complete ly randomized experiment are shown in the following table: Circuit Type 12 21 Response Time 10 23 15 30 20 17 16 (c) Use the graphical procedure in Section 3.5.3 to com- pare the treatment means. What conclusions can you draw? How do they compare with the conclusions from part...
 How to solve the question by using SAS?Could you please
give me copies of relevant SAS output?Thanks!
3.16. An experiment was run to determine whether four specific firing temperatures affect the density of a certain type of brick. A completely randomized experiment led to the fol- lowing data: emperature Density 100 125 150 175 21.821.921.7 21.721.4 21.5 21.921.821.821.621.5 21.921.721.8 21.4 21.6 21.7 21.4 (a) Does the firing temperature affect the density of the bricks? Use a - 0.05 (b) Is...
How to solve the question by using SAS?Could you please
give me copies of relevant SAS output?Thanks!
3.16. An experiment was run to determine whether four specific firing temperatures affect the density of a certain type of brick. A completely randomized experiment led to the fol- lowing data: emperature Density 100 125 150 175 21.821.921.7 21.721.4 21.5 21.921.821.821.621.5 21.921.721.8 21.4 21.6 21.7 21.4 (a) Does the firing temperature affect the density of the bricks? Use a - 0.05 (b) Is...
 Please use SAS to solve and show the code thank
you.
3.26. Three brands of batteries are under study. It is suspect- ed that the lives (in weeks) of the three brands are different. Five randomly selected batteries of each brand are tested with the following results: Weeks of Life Brand 1 Brand 2 Brand 3 100 96 92 96 92 76 80 75 84 82 108 100 96 98 100 We were unable to transcribe this image
Please use SAS to solve and show the code thank
you.
3.26. Three brands of batteries are under study. It is suspect- ed that the lives (in weeks) of the three brands are different. Five randomly selected batteries of each brand are tested with the following results: Weeks of Life Brand 1 Brand 2 Brand 3 100 96 92 96 92 76 80 75 84 82 108 100 96 98 100 We were unable to transcribe this image
 3. Reaction time experiment (L. Cai, T. Li, Nishant, and A. van der Kouwe, 1996) The experiment was run to compare the effects of auditory and visual cues on speed of response of a human subject. A personal computer was used to present a "stimulus" to a subject, and the reaction time required for the subject to press a key was monitored. The subject was warned that the stimulus was forthcoming by means of an auditory or a visual cue....
 *Please perform all calculations by hand or using
Minitab. Thank you.*
our different designs for a digital computer circuit are being studied to compare the amount of noise present. The following data have been obtained: Circuit Design Noise Observed 47 80 95 19 35 61 80 97 73 83 19 2 78 30 20 4 a) Is the same amount of noise present for all four designs? Use α 0.05. b) Analyze the residuals from this experiment. Are the analysis...
*Please perform all calculations by hand or using
Minitab. Thank you.*
our different designs for a digital computer circuit are being studied to compare the amount of noise present. The following data have been obtained: Circuit Design Noise Observed 47 80 95 19 35 61 80 97 73 83 19 2 78 30 20 4 a) Is the same amount of noise present for all four designs? Use α 0.05. b) Analyze the residuals from this experiment. Are the analysis...
 Can you please do part (c) in
Rstudio and show me your code? Thank you!
3.10. A product developer is investigating the tensile strength of a new synthetic fiber that wl be used to make cloth for men's shirts. Strength is usually affected by the percentage of cotton used in the blend of materials for the fiber. The engineer conducts a completely randomized experiment with five levels of cotton content and replicates the experiment five times. The data are shown...
Can you please do part (c) in
Rstudio and show me your code? Thank you!
3.10. A product developer is investigating the tensile strength of a new synthetic fiber that wl be used to make cloth for men's shirts. Strength is usually affected by the percentage of cotton used in the blend of materials for the fiber. The engineer conducts a completely randomized experiment with five levels of cotton content and replicates the experiment five times. The data are shown...
 Can you please solve number 6 and number 1. Please explain
clearly. Thank you.
Fill in the table below with the data you collected during Experiment 2. Fill in the following table with the percentage of each type of kennel. According to your results in Experiment 2, what would be the correct hypothesis to test to see if the traits were inherited through genetics? Record this answer for use in a later question. The hypothesis is null hypothesis. For the...
Can you please solve number 6 and number 1. Please explain
clearly. Thank you.
Fill in the table below with the data you collected during Experiment 2. Fill in the following table with the percentage of each type of kennel. According to your results in Experiment 2, what would be the correct hypothesis to test to see if the traits were inherited through genetics? Record this answer for use in a later question. The hypothesis is null hypothesis. For the...
 Use Excel, and show code for how to calculate. Thank You
5.1 Consider the following response time data measured in seconds.* 1.49 1.70 1.61 1.43 1.29 1.36 1.66 1.42 1.56 1.25 1.80 1.51 1.50 1.44 1.35 1.58 1.31 1.32 1.48 1.47 1.29 1.46 1.62 1.48 1.48 1.34 1.59 1.66 1.55 1.61 1.52 1.80 1.64 1.46 1.38 1.56 1.62 1.30 1.56 1.27 1.37 1.46 1.42 1.59 1.58 1.60 1.67 1.37 1.55 1.55 1.57 1.66 1.38 1.49 1.58 1.48 1.30 1.68 1.65...
Use Excel, and show code for how to calculate. Thank You
5.1 Consider the following response time data measured in seconds.* 1.49 1.70 1.61 1.43 1.29 1.36 1.66 1.42 1.56 1.25 1.80 1.51 1.50 1.44 1.35 1.58 1.31 1.32 1.48 1.47 1.29 1.46 1.62 1.48 1.48 1.34 1.59 1.66 1.55 1.61 1.52 1.80 1.64 1.46 1.38 1.56 1.62 1.30 1.56 1.27 1.37 1.46 1.42 1.59 1.58 1.60 1.67 1.37 1.55 1.55 1.57 1.66 1.38 1.49 1.58 1.48 1.30 1.68 1.65...
 Please show formulas you use, it isn't multiple
questions only 1. Teacher likes to break the question into multiple
parts to help students with the steps. Thank you :)!
5. Perform a hypothesis test to determine if a difference exists in the proportion of uninsured drivers between the states of Mississippi and Tennessee. A random sample of 150 drivers from Mississippi found that 42 were uninsured. A random sample of 125 drivers from Tennessee found that 23 were uninsured. Define...
Please show formulas you use, it isn't multiple
questions only 1. Teacher likes to break the question into multiple
parts to help students with the steps. Thank you :)!
5. Perform a hypothesis test to determine if a difference exists in the proportion of uninsured drivers between the states of Mississippi and Tennessee. A random sample of 150 drivers from Mississippi found that 42 were uninsured. A random sample of 125 drivers from Tennessee found that 23 were uninsured. Define...
Most questions answered within 3 hours.
-
Why does Max Weber distinguish between "power," "authority," and
different types of authority? What is he...
asked 2 minutes ago -
In recent years, 80% of those accused of Driving Under the
Influence (DUI) get convicted (includes...
asked 1 minute ago -
What would the solow growth model look like if there was a
production function which had...
asked 7 minutes ago -
A company project has an initial cost of $40,000, expected net
cash flows of $9,000 per...
asked 8 minutes ago -
How do you use strategy in your current position or how does
your current position align...
asked 11 minutes ago -
a person's ability to be properly diagnosed with a
disease/condition can be affected by the person;s...
asked 10 minutes ago -
John needs 40 Eternal Light flashlights. Each Eternal Light
flashlight requires 3 bulbs, and each bulb...
asked 18 minutes ago -
1) If Nominal GDP is $16,000 billion and the GDP deflator is 50,
then Real GDP...
asked 24 minutes ago -
D. A student completed 20 courses in the School of Arts and
Sciences. Her grades in...
asked 2 hours ago -
teo
pucks moving on a frictionless air table are about to collide. the
1.5 kg puck...
asked 2 hours ago -
Problem #1
The area between Z = 0 and Z = 2.50
The area between Z...
asked 3 hours ago -
1. What is the meaning of the term communication style?
2. What are the benefits to...
asked 3 hours ago