
Homework Answers
a. Mean and Median of low temperatures are
| Variable | Mean | Median |
| Low temperatures | 47.67 | 47.50 |
b. 
A time series plot of the average Low and High temperatures in one graph.
c. The short cut formula to calculate sampling variance is
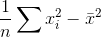
Using this formula we get sampling variance of high temperatures is 274.00
d.
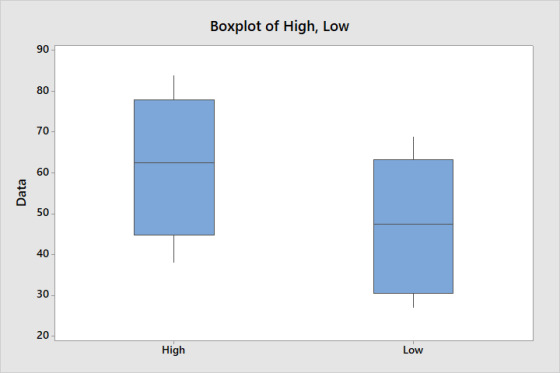
Boxplot of high temperatures vs low temperatures.
Add Answer to:
1. The monthly average New York City temperature in Fahrenheit are given below Month Jan FebMarApr...
The data below are the monthly average high temperatures for New York City. What is the...
The data below are the monthly average high temperatures for New York City. What is the five-number summary? 40, 40, 48, 61, 72, 78, 84, 84, 76, 65, 54, 42
Use the accompanying data set on the pulse rates (in beats per minute) of males to...
Use the accompanying data set on the pulse rates (in beats per minute) of males to complete parts (a) and (b) below. LOADING... Click the icon to view the pulse rates of males. a. Find the mean and standard deviation, and verify that the pulse rates have a distribution that is roughly normal. The mean of the pulse rates is 71.871.8 beats per minute. (Round to one decimal place as needed.) The standard deviation of the pulse rates is 12.212.2...
2.Heights of the Highest Waterfalls The heights in feet) of the 20 highest waterfalls in the...
 2.Heights of the Highest Waterfalls The heights in feet) of the 20 highest waterfalls in the world are shown here. (Note: The height of Niagara Falls is 182 feet!) below. Based on these data, what do you think of the claim that the average expenditure per pupil in the United States exceeds $10,000? a 94222 b 8988 3212 2800 2625 2540 2499 2425 2307 2151 2123 2000 1904 1841 1650 1612 1536 1388 1215 1198 1182 1170 Source: New York...
Please show how you did this in excel. :13-19 Every home football game for the past...
 Please show how you did this in excel.
:13-19 Every home football game for the past eight years at Eastern State University has been sold out. The revenues from ticket sales are significant, but the sale of food, beverages, and souvenirs has contrib- uted greatly to the overall profitability of the football program. One particular souvenir is the football pro- gram for each game. The number of programs sold at each game is described by the following probabil- ity distribution:...
Please show how you did this in excel.
:13-19 Every home football game for the past eight years at Eastern State University has been sold out. The revenues from ticket sales are significant, but the sale of food, beverages, and souvenirs has contrib- uted greatly to the overall profitability of the football program. One particular souvenir is the football pro- gram for each game. The number of programs sold at each game is described by the following probabil- ity distribution:...
Use C++ (2D Array) Write a program which: 1. Assigns data given below into the 2D...
Use C++ (2D Array) Write a program which: 1. Assigns data given below into the 2D array of integers which is 10x10. 2. Prints out the contents of the 2D array after assigning the data to make sure correct data was assigned. 3. Figures out and prints out the square root of the sum of ALL the elements in the 2D array. 4. Figures out and prints out the average of ALL THE ELEMENTS in the 2D array. 5. Figures...
I need to develop the 7 functions below into the main program that's given on top...
 I need to develop the 7 functions below into the main program
that's given on top
Write a C program to create array, with random numbers and perform operations show below. Il Project 3 (53-20). 1 Projects CS5,00 This file contains the function Programcution Dagine and one include <timo // Defining some constants definer_SIZE 20 define LOVE LIMIT 1 eine UPR UNIT define TALSE eine Tut 1 wold randomizery (int[], int, Int, int) wold pinay in. St, Int); En find...
I need to develop the 7 functions below into the main program
that's given on top
Write a C program to create array, with random numbers and perform operations show below. Il Project 3 (53-20). 1 Projects CS5,00 This file contains the function Programcution Dagine and one include <timo // Defining some constants definer_SIZE 20 define LOVE LIMIT 1 eine UPR UNIT define TALSE eine Tut 1 wold randomizery (int[], int, Int, int) wold pinay in. St, Int); En find...
Use Kilometer Converter application code to write Temperature Converter application to convert degrees Fahrenheit into degrees...
 Use Kilometer Converter application code to write Temperature
Converter application to convert degrees Fahrenheit into degrees
Celsius ((F - 32)*5/9). It needs to be JavaFX
1 import javafx.application. Application; 2 import javafx.stage. Stage; 3 import javafx.scene. Scene; 4 import javafx.scene.layout.HBox; 5 import javafx.scene.layout. VBox; 6 import javafx.geometry.Pos; 7 import javafx.geometry.Insets; 8 import javafx.scene.control.Label; 9 import javafx.scene.control. TextField; 10 import javafx.scene.control.Button; 11 import javafx.event. EventHandler; 12 import javafx.event. ActionEvent; 13 14 ** 15 * Kilometer Converter application 16 17 18 public...
Use Kilometer Converter application code to write Temperature
Converter application to convert degrees Fahrenheit into degrees
Celsius ((F - 32)*5/9). It needs to be JavaFX
1 import javafx.application. Application; 2 import javafx.stage. Stage; 3 import javafx.scene. Scene; 4 import javafx.scene.layout.HBox; 5 import javafx.scene.layout. VBox; 6 import javafx.geometry.Pos; 7 import javafx.geometry.Insets; 8 import javafx.scene.control.Label; 9 import javafx.scene.control. TextField; 10 import javafx.scene.control.Button; 11 import javafx.event. EventHandler; 12 import javafx.event. ActionEvent; 13 14 ** 15 * Kilometer Converter application 16 17 18 public...
1. The data set on sheet #1 gives data on GPA category and number of hours studied. Construct com...
1. The data set on sheet #1 gives data on GPA category and number of hours studied. Construct comparative box plots of the data first GPA category. Then conduct two-sample t-test on the data for whether GPA category influences the number of hours studied. Be prepared to explain the results of the test and the meaning of the boxplots and how they relate to each other. Then redo the analysis by replacing the ordinal GPA category with a numerical dummy...
7. (a) (15 pts.) With Figure 1 below showing shifts A and B, fill in the blank Table 1 showing the computation of the...
 7. (a) (15 pts.) With Figure 1 below showing shifts A and B, fill in the blank Table 1 showing the computation of the fraction of Bin Hours in each shift for the different time groups. VI V IV Group 1 A 9-12 13-16 17-20 21-24 Sunday Monday Tuesday Wednesday B B Thursday Friday Saturday Figure 1 Table 1 Computation of Fraction of Bin Hours in Each Shift Days Total in Shift A Fraction in Each Shift B Fraction in...
C# 1. Given two lengths between 0 and 9, create an rowLength by colLength matrix with...
C# 1. Given two lengths between 0 and 9, create an rowLength by colLength matrix with each element representing its column and row value, starting from 1. So the element at the first column and the first row will be 11. If either length is out of the range, simply return a null. For exmaple, if colLength = 5 and rowLength = 4, you will see: 11 12 13 14 15 21 22 23 24 25 31 32 33 34...
 2.Heights of the Highest Waterfalls The heights in feet) of the 20 highest waterfalls in the world are shown here. (Note: The height of Niagara Falls is 182 feet!) below. Based on these data, what do you think of the claim that the average expenditure per pupil in the United States exceeds $10,000? a 94222 b 8988 3212 2800 2625 2540 2499 2425 2307 2151 2123 2000 1904 1841 1650 1612 1536 1388 1215 1198 1182 1170 Source: New York...
 Please show how you did this in excel.
:13-19 Every home football game for the past eight years at Eastern State University has been sold out. The revenues from ticket sales are significant, but the sale of food, beverages, and souvenirs has contrib- uted greatly to the overall profitability of the football program. One particular souvenir is the football pro- gram for each game. The number of programs sold at each game is described by the following probabil- ity distribution:...
Please show how you did this in excel.
:13-19 Every home football game for the past eight years at Eastern State University has been sold out. The revenues from ticket sales are significant, but the sale of food, beverages, and souvenirs has contrib- uted greatly to the overall profitability of the football program. One particular souvenir is the football pro- gram for each game. The number of programs sold at each game is described by the following probabil- ity distribution:...
 I need to develop the 7 functions below into the main program
that's given on top
Write a C program to create array, with random numbers and perform operations show below. Il Project 3 (53-20). 1 Projects CS5,00 This file contains the function Programcution Dagine and one include <timo // Defining some constants definer_SIZE 20 define LOVE LIMIT 1 eine UPR UNIT define TALSE eine Tut 1 wold randomizery (int[], int, Int, int) wold pinay in. St, Int); En find...
I need to develop the 7 functions below into the main program
that's given on top
Write a C program to create array, with random numbers and perform operations show below. Il Project 3 (53-20). 1 Projects CS5,00 This file contains the function Programcution Dagine and one include <timo // Defining some constants definer_SIZE 20 define LOVE LIMIT 1 eine UPR UNIT define TALSE eine Tut 1 wold randomizery (int[], int, Int, int) wold pinay in. St, Int); En find...
 Use Kilometer Converter application code to write Temperature
Converter application to convert degrees Fahrenheit into degrees
Celsius ((F - 32)*5/9). It needs to be JavaFX
1 import javafx.application. Application; 2 import javafx.stage. Stage; 3 import javafx.scene. Scene; 4 import javafx.scene.layout.HBox; 5 import javafx.scene.layout. VBox; 6 import javafx.geometry.Pos; 7 import javafx.geometry.Insets; 8 import javafx.scene.control.Label; 9 import javafx.scene.control. TextField; 10 import javafx.scene.control.Button; 11 import javafx.event. EventHandler; 12 import javafx.event. ActionEvent; 13 14 ** 15 * Kilometer Converter application 16 17 18 public...
Use Kilometer Converter application code to write Temperature
Converter application to convert degrees Fahrenheit into degrees
Celsius ((F - 32)*5/9). It needs to be JavaFX
1 import javafx.application. Application; 2 import javafx.stage. Stage; 3 import javafx.scene. Scene; 4 import javafx.scene.layout.HBox; 5 import javafx.scene.layout. VBox; 6 import javafx.geometry.Pos; 7 import javafx.geometry.Insets; 8 import javafx.scene.control.Label; 9 import javafx.scene.control. TextField; 10 import javafx.scene.control.Button; 11 import javafx.event. EventHandler; 12 import javafx.event. ActionEvent; 13 14 ** 15 * Kilometer Converter application 16 17 18 public...
 7. (a) (15 pts.) With Figure 1 below showing shifts A and B, fill in the blank Table 1 showing the computation of the fraction of Bin Hours in each shift for the different time groups. VI V IV Group 1 A 9-12 13-16 17-20 21-24 Sunday Monday Tuesday Wednesday B B Thursday Friday Saturday Figure 1 Table 1 Computation of Fraction of Bin Hours in Each Shift Days Total in Shift A Fraction in Each Shift B Fraction in...
Most questions answered within 3 hours.
-
Create a balanced compensation plan that you feel would
encourage a restaurant manager to be more...
asked 1 minute ago -
Re: Human Physiology
Comment on the differences between representing V02 max as an
absolute number and...
asked 3 minutes ago -
A firm with a WACC of 10% is considering the following mutually
exclusive projects:
0
1...
asked 8 minutes ago -
. A 100.0 mL sample of 0.18 M HClO4 is titrated with 0.27 M
LiOH. Determine...
asked 31 minutes ago -
A regression equation that describes the relationship between
the amount of the bill ($) at a...
asked 1 hour ago -
exercise on VSEPR and molecular structrue.
octahedral
SeCl62-
TeCl62-
ClF62-
distorted
SeF62–
IF6–
asked 1 hour ago -
284 mL of a 0.52 M potassium hydroxide solution is added to 467
mL of a...
asked 1 hour ago -
Little’s Law: Val d’Costa is a world famous ski village in the
French Alps. Because of...
asked 2 hours ago -
Find the absolute error D for the calculation if A + B/C=D A=
9.4 +/- 0.4...
asked 3 hours ago -
New Air Heating and Cooling, manufactures furnaces and central
air units. The company pride itself on...
asked 3 hours ago -
A coach uses a new technique to train gymnasts. Seven
gymnasts were randomly selected and their...
asked 5 hours ago -
While rotating the tires on your car you notice a rock [mass =
0.1 Kg] stuck...
asked 7 hours ago