
Homework Answers
Add Answer to:
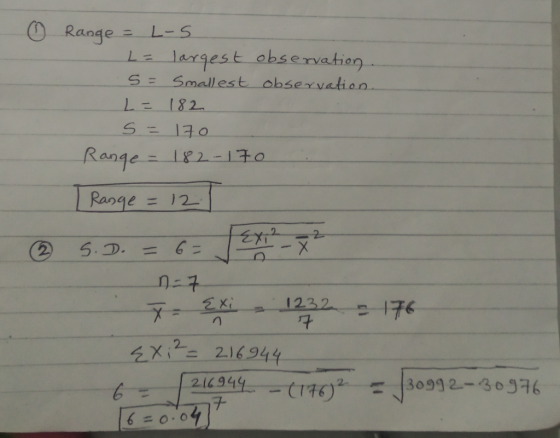
Find the range and standard deviation of the set of data 170, 172, 174, 176, 178,...
Find the range and standard deviation of the set of data 3,7,3,7,7, 10, 12 The range is 9. (Simplify your answer.)...
 Find the range and standard deviation of the set of data 3,7,3,7,7, 10, 12 The range is 9. (Simplify your answer.) The standard deviation is (Round the final answer to the nearest hundredth as needed Round all intermediate values to the nearest hundredth as needed
Find the range and standard deviation of the set of data 5,9,5,9, 9, 12, 14 The...
 Find the range and standard deviation of the set of data 5,9,5,9, 9, 12, 14 The range is (Simplify your answer.) The standard deviation is (Round the final answer to the nearest hundredth as needed. Round all intermediate values to the neareste hundredth as
Find the range and standard deviation of the set of data 5, 9, 10, 12, 14,...
 Find the range and standard deviation of the set of data 5, 9, 10, 12, 14, 16 The range is 11 (Simplify your answer) The standard deviation is (Round the final answer to the nearest hundredth as needed Round all intermediate values to the nearest hundredth as needed
Determine the range and standard deviation of the prices of digital cameras shown below $159, 593,...
 Determine the range and standard deviation of the prices of digital cameras shown below $159, 593, $175, $179, $97. $129, $229, $299 E The range of the prices is $ 206 (Simplify your answer) The standard deviation of the prices is $ (Round the final answer to the nearest cent as needed Round all intermediate values to the nearest cent as needed)
Determine the range and standard deviation of the prices of camping tents shown below. $110, $59,...
 Determine the range and standard deviation of the prices of camping tents shown below. $110, $59, $80, $59, $211, $251, $59, $102, $104 The range of the prices is $ 192. (Simplify your answer) The standard deviation of the prices is $ (Round the final answer to the nearest cent as needed. Round all intermediate values to the nearest cent as needed.)
Suppose a normally distributed set of data has a mean of 172 and a standard deviation...
Suppose a normally distributed set of data has a mean of 172 and a standard deviation of 15. Use the 68-95-99.7 rule to determine the percent of scores in the data set expected to be between the scores 142 and 187. Give your answer in decimal form and keep all decimal places throughout your calculations and in your final answer.
A sample of closing stock prices was recorded as: 182, 168, 184, 190, 170, and 174....
A sample of closing stock prices was recorded as: 182, 168, 184, 190, 170, and 174. Compute the following sample statistics. a) Find the Sample Mean. (2) b) Is there a Mode? Briefly explain your answer. c) Use the index method and find the median of the data. d) Find the Range of the data. e) Construct the Basic Data summary table (as in class). f) Find the Sample Variance and the Sample Standard Deviation.
You will start by considering the data set in the proj2-2.txt file on BlackBoard. The data set contains SEX (1=female; 2=male), PEFR in l/min and height in cm. 1. Make a scatter plot of PEFR versus...
You will start by considering the data set in the proj2-2.txt file on BlackBoard. The data set contains SEX (1=female; 2=male), PEFR in l/min and height in cm. 1. Make a scatter plot of PEFR versus height. 2. Fit the simple linear regression of PEFR on height. 3. What is the estimated slope (with CI) and the interpretation of this estimate. 4. What is the standard deviation around the line (with CI) and the interpretation of this estimate. 5. Estimate...
12. Below are the range and standard deviation for a set of data. Use the range...
 12. Below are the range and standard deviation for a set of
data. Use the range rule of thumb and compare it to the standard
deviation listed below. Does the range rule of thumb produce an
acceptable approximation? Suppose a researcher deems the
approximation as acceptable if it has an error less than 15%.
The estimated standard deviation is___
(Round to three decimal places as needed.)
s this an acceptableapproximation?
A:.No, because the error of the range rule of thumb's...
12. Below are the range and standard deviation for a set of
data. Use the range rule of thumb and compare it to the standard
deviation listed below. Does the range rule of thumb produce an
acceptable approximation? Suppose a researcher deems the
approximation as acceptable if it has an error less than 15%.
The estimated standard deviation is___
(Round to three decimal places as needed.)
s this an acceptableapproximation?
A:.No, because the error of the range rule of thumb's...
Thenges in yours) of a random sample of shoppers at a gaming store are shown. Determine...
 Thenges in yours) of a random sample of shoppers at a gaming store are shown. Determine the range, mesin, variance, and standard deviation of the sample data set. 12, 21, 23, 15, 21, 17, 20, 17, 13, 16 The range is (Simplify your answer.) The mean is (Simplify your answer. Round to the nearest tenth as needed) The variance is (Simplify your answer. Round to the nearest hundredth as needed.) The standard deviation is (Simplify your answer. Round to the...
 Find the range and standard deviation of the set of data 3,7,3,7,7, 10, 12 The range is 9. (Simplify your answer.) The standard deviation is (Round the final answer to the nearest hundredth as needed Round all intermediate values to the nearest hundredth as needed
 Find the range and standard deviation of the set of data 5,9,5,9, 9, 12, 14 The range is (Simplify your answer.) The standard deviation is (Round the final answer to the nearest hundredth as needed. Round all intermediate values to the neareste hundredth as
 Find the range and standard deviation of the set of data 5, 9, 10, 12, 14, 16 The range is 11 (Simplify your answer) The standard deviation is (Round the final answer to the nearest hundredth as needed Round all intermediate values to the nearest hundredth as needed
 Determine the range and standard deviation of the prices of digital cameras shown below $159, 593, $175, $179, $97. $129, $229, $299 E The range of the prices is $ 206 (Simplify your answer) The standard deviation of the prices is $ (Round the final answer to the nearest cent as needed Round all intermediate values to the nearest cent as needed)
 Determine the range and standard deviation of the prices of camping tents shown below. $110, $59, $80, $59, $211, $251, $59, $102, $104 The range of the prices is $ 192. (Simplify your answer) The standard deviation of the prices is $ (Round the final answer to the nearest cent as needed. Round all intermediate values to the nearest cent as needed.)
 12. Below are the range and standard deviation for a set of
data. Use the range rule of thumb and compare it to the standard
deviation listed below. Does the range rule of thumb produce an
acceptable approximation? Suppose a researcher deems the
approximation as acceptable if it has an error less than 15%.
The estimated standard deviation is___
(Round to three decimal places as needed.)
s this an acceptableapproximation?
A:.No, because the error of the range rule of thumb's...
12. Below are the range and standard deviation for a set of
data. Use the range rule of thumb and compare it to the standard
deviation listed below. Does the range rule of thumb produce an
acceptable approximation? Suppose a researcher deems the
approximation as acceptable if it has an error less than 15%.
The estimated standard deviation is___
(Round to three decimal places as needed.)
s this an acceptableapproximation?
A:.No, because the error of the range rule of thumb's...
 Thenges in yours) of a random sample of shoppers at a gaming store are shown. Determine the range, mesin, variance, and standard deviation of the sample data set. 12, 21, 23, 15, 21, 17, 20, 17, 13, 16 The range is (Simplify your answer.) The mean is (Simplify your answer. Round to the nearest tenth as needed) The variance is (Simplify your answer. Round to the nearest hundredth as needed.) The standard deviation is (Simplify your answer. Round to the...
Most questions answered within 3 hours.
-
Under the influence of its drive force, a snowmobile is moving
at a constant velocity along...
asked 26 seconds ago -
What mechanisms Drive speciation??
(I.e. what was Dawins theory on the orgin of species, and how...
asked 1 hour ago -
The manager at a car assembly plant believes that the mean
assembly time for a car...
asked 2 hours ago -
Which of the following is true of electron capture?
A) It decreases the nuclide's mass number...
asked 3 hours ago -
Assuming an efficiency of 43.10%, calculate the actual yield of
magnesium nitrate formed from 114.9 g...
asked 4 hours ago -
The highly pathogenic bacterium Clostridium
perfringens causes gangrene, a disease that results in the
destruction of...
asked 6 hours ago -
In the context of situation analysis, which of the following is
a category for analysis in...
asked 6 hours ago -
In a study of the gas phase decomposition of sulfuryl chloride
at 600 K SO2Cl2(g)SO2(g) +...
asked 6 hours ago -
75 g of 2-propanol (C3H8O) and 25 g of pentane are mixed in a
200 mL...
asked 6 hours ago -
The 2800-turn coil in a dc motor has an area per turn of 1.1 ×
10-2...
asked 6 hours ago -
Draw a combinational logic circuit diagram with a symbol inside
the box for two I/P of...
asked 6 hours ago -
The cliché we use quite a lot in finance is: there is a need to
maximize...
asked 6 hours ago