those pictures are for the one question, please answer all of them. Thanks!
Homework Answers
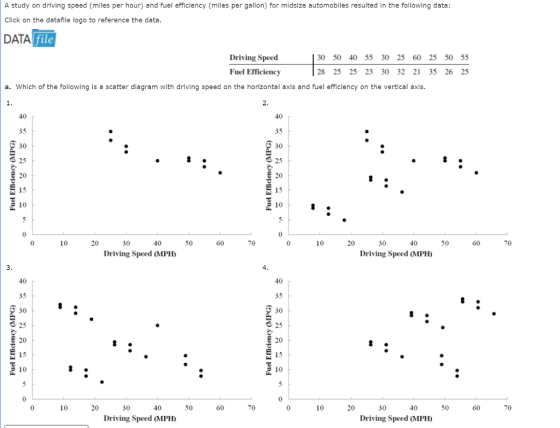
A) Figure 1 represents the given data
B) Negative with strong correlation
(Since the points are closely arranged with a negative slope)
Add Answer to:
those pictures are for the one question, please answer all of
them. Thanks!
A study on...
Check My Work A study on driving speed (miles per hour) and fuel efficiency (miles per...
 Check My Work A study on driving speed (miles per hour) and fuel efficiency (miles per gallon) for midsize automobiles resulted in the following data: Click on the datafile logo to reference the data. DATA file Driving Speed Fuel Efficiency a. Which of the following is a scatter diagram with driving speed on the horizontal axis and fuel efficiency on the vertical axis. 30 50 40 55 30 25 60 25 50 55 28 25 25 23 30 32 21...
A department of transportation’s study on driving speed and miles per gallon for midsize automobiles resulted...
A department of transportation’s study on driving speed and miles per gallon for midsize automobiles resulted in the following data: speed (miles per hour) 30 50 40 55 30 25 60 25 50 55 Miles per Gallon 28 25 25 23 30 32 21 35 26 25 Answer the following questions and calculate the following descriptive statistics: a) What type of data is it? (cross-sectional, time-series, or panel) b) How many observations in this data? c) Identify types of variables...
Calculate the following descriptive statistics for both variables: a. Mean b. Median c. Mode d. 25th...
 Calculate the following descriptive statistics for both
variables:
a. Mean
b. Median
c. Mode
d. 25th Percentile
e. 75th Percentile
f. Variance
g. Standard Deviation
h. Correlation
Question 3 (60 points): A department of transportation's study on driving speed and miles per gallon for midsize automobiles resulted in the following data Speed (miles erhr30 50 40 55 30 25 60 25 50 55 Miles per Gallon28 2525 23 30 32 21 35 2625
Calculate the following descriptive statistics for both
variables:
a. Mean
b. Median
c. Mode
d. 25th Percentile
e. 75th Percentile
f. Variance
g. Standard Deviation
h. Correlation
Question 3 (60 points): A department of transportation's study on driving speed and miles per gallon for midsize automobiles resulted in the following data Speed (miles erhr30 50 40 55 30 25 60 25 50 55 Miles per Gallon28 2525 23 30 32 21 35 2625
those pictures are for the one question, please answer all of them. Thanks! The Northwest reglonal...
 those pictures are for the one question, please answer all of
them. Thanks!
The Northwest reglonal manager of an outdoor equipment retaller conducted a study to determine how managers at three store locations are using thelr time. A summary of the results are shown In the following table. Cllck on the dataflle logo to reference the data DATA file Percentage of Manager's Work Week Spent on Store Location Bend Seattle Meetings 18 52 32 Reports Customers Idle 52 24 37...
those pictures are for the one question, please answer all of
them. Thanks!
The Northwest reglonal manager of an outdoor equipment retaller conducted a study to determine how managers at three store locations are using thelr time. A summary of the results are shown In the following table. Cllck on the dataflle logo to reference the data DATA file Percentage of Manager's Work Week Spent on Store Location Bend Seattle Meetings 18 52 32 Reports Customers Idle 52 24 37...
those pictures are for the one question, please answer all of them. Thanks! eBook Each year...
 those pictures are for the one question, please answer all of
them. Thanks!
eBook Each year Forbes ranks the world's most valuable brands. A portion of the data for 82 of the brands in the 2013 Forbes list is shown in Table 2.12 (Forbes website, February, 2014), The data set includes the following varlables: The name of the brand The type of Industry assoclated with the brand, labeled Automotive & LuxuryY, Consumer Packaged Goods, Financial Services, Other, Technology A measure...
those pictures are for the one question, please answer all of
them. Thanks!
eBook Each year Forbes ranks the world's most valuable brands. A portion of the data for 82 of the brands in the 2013 Forbes list is shown in Table 2.12 (Forbes website, February, 2014), The data set includes the following varlables: The name of the brand The type of Industry assoclated with the brand, labeled Automotive & LuxuryY, Consumer Packaged Goods, Financial Services, Other, Technology A measure...
those pictures are for the one question, please answer all of them. Thanks! A start-up company's...
 those pictures are for the one question, please answer all of
them. Thanks!
A start-up company's ability to gain funding is a key to success. The amount of funds raised (in millions of dollars) for fifty hot start-up companies follow (source: Wail Street Journal, March 10, 2011). Click on the dataflle logo to reference the data DATA ETE file $61S103 $166 $168 $80 $51 130 $77 $78 $60 $20 $73 $50 S110 $21$60 $49 63 $91S272 $58S54$40 $47 $24$57 $78...
those pictures are for the one question, please answer all of
them. Thanks!
A start-up company's ability to gain funding is a key to success. The amount of funds raised (in millions of dollars) for fifty hot start-up companies follow (source: Wail Street Journal, March 10, 2011). Click on the dataflle logo to reference the data DATA ETE file $61S103 $166 $168 $80 $51 130 $77 $78 $60 $20 $73 $50 S110 $21$60 $49 63 $91S272 $58S54$40 $47 $24$57 $78...
A department of transportation's study on driving speed and miles per gallon for midsize automobiles resulted in t...
 A department of transportation's study on driving speed and miles per gallon for midsize automobiles resulted in the following data Speed (Miles per our30 50 40 55 30 24 60 25 51 55 Miles per Gallon 28 24 24 23 30 32 21 35 26 25 Compute the sample correlation coefficient (to 2 decimals and enter negative value as negative number) What can you conclude, based on your computation of the sample correlation coefficient? - Select your answer- Select the...
A department of transportation's study on driving speed and miles per gallon for midsize automobiles resulted...
 A department of transportation's study on driving speed and miles per gallon for midsize automobiles resulted in the following data: Speed (Miles per Hour) 30 50 40 55 30 24 60 24 51 56 Miles per Gallon 28 24 24 22 30 33 21 Compute the sample correlation coefficient (to 2 decimals and enter negative value as negative number). 35 26 24 What can you conclude, based on your computation of the sample correlation coefficient? - Select your answer -...
Those questions are for the same question, please answer all of them. Thanks~ eBook Each year...
 Those questions are for the same question, please answer all of
them. Thanks~
eBook Each year America.EDU ranks the best paying college degrees In America. The followlng data show the medlan starting salary, the mld-career salary, and the percentage Increase from starting salary to mld career salary for the 20 college degrees with the highest mid-career salary (America.EDU website, August 29, 2013) Click on the datafile logo to reference the data DATA file Starting Salary Mid-Career Salary %Increase Aerospace engineering...
Those questions are for the same question, please answer all of
them. Thanks~
eBook Each year America.EDU ranks the best paying college degrees In America. The followlng data show the medlan starting salary, the mld-career salary, and the percentage Increase from starting salary to mld career salary for the 20 college degrees with the highest mid-career salary (America.EDU website, August 29, 2013) Click on the datafile logo to reference the data DATA file Starting Salary Mid-Career Salary %Increase Aerospace engineering...
Answer the question on the basis of the following five data sets, wherein it is assumed...
 Answer the question on the basis of the following five data sets, wherein it is assumed that the variable shown on the left is the independent variable and the one on the right is the dependent variable. Assume in graphing these data that the independent variable is shown on the horizontal axis and the dependent variable on the vertical axis 3) 0 -15 100 40 15 25 0 1e 5 1e 35 10 20 120 40 9 15 40 70...
 Check My Work A study on driving speed (miles per hour) and fuel efficiency (miles per gallon) for midsize automobiles resulted in the following data: Click on the datafile logo to reference the data. DATA file Driving Speed Fuel Efficiency a. Which of the following is a scatter diagram with driving speed on the horizontal axis and fuel efficiency on the vertical axis. 30 50 40 55 30 25 60 25 50 55 28 25 25 23 30 32 21...
 Calculate the following descriptive statistics for both
variables:
a. Mean
b. Median
c. Mode
d. 25th Percentile
e. 75th Percentile
f. Variance
g. Standard Deviation
h. Correlation
Question 3 (60 points): A department of transportation's study on driving speed and miles per gallon for midsize automobiles resulted in the following data Speed (miles erhr30 50 40 55 30 25 60 25 50 55 Miles per Gallon28 2525 23 30 32 21 35 2625
Calculate the following descriptive statistics for both
variables:
a. Mean
b. Median
c. Mode
d. 25th Percentile
e. 75th Percentile
f. Variance
g. Standard Deviation
h. Correlation
Question 3 (60 points): A department of transportation's study on driving speed and miles per gallon for midsize automobiles resulted in the following data Speed (miles erhr30 50 40 55 30 25 60 25 50 55 Miles per Gallon28 2525 23 30 32 21 35 2625
 those pictures are for the one question, please answer all of
them. Thanks!
The Northwest reglonal manager of an outdoor equipment retaller conducted a study to determine how managers at three store locations are using thelr time. A summary of the results are shown In the following table. Cllck on the dataflle logo to reference the data DATA file Percentage of Manager's Work Week Spent on Store Location Bend Seattle Meetings 18 52 32 Reports Customers Idle 52 24 37...
those pictures are for the one question, please answer all of
them. Thanks!
The Northwest reglonal manager of an outdoor equipment retaller conducted a study to determine how managers at three store locations are using thelr time. A summary of the results are shown In the following table. Cllck on the dataflle logo to reference the data DATA file Percentage of Manager's Work Week Spent on Store Location Bend Seattle Meetings 18 52 32 Reports Customers Idle 52 24 37...
 those pictures are for the one question, please answer all of
them. Thanks!
eBook Each year Forbes ranks the world's most valuable brands. A portion of the data for 82 of the brands in the 2013 Forbes list is shown in Table 2.12 (Forbes website, February, 2014), The data set includes the following varlables: The name of the brand The type of Industry assoclated with the brand, labeled Automotive & LuxuryY, Consumer Packaged Goods, Financial Services, Other, Technology A measure...
those pictures are for the one question, please answer all of
them. Thanks!
eBook Each year Forbes ranks the world's most valuable brands. A portion of the data for 82 of the brands in the 2013 Forbes list is shown in Table 2.12 (Forbes website, February, 2014), The data set includes the following varlables: The name of the brand The type of Industry assoclated with the brand, labeled Automotive & LuxuryY, Consumer Packaged Goods, Financial Services, Other, Technology A measure...
 those pictures are for the one question, please answer all of
them. Thanks!
A start-up company's ability to gain funding is a key to success. The amount of funds raised (in millions of dollars) for fifty hot start-up companies follow (source: Wail Street Journal, March 10, 2011). Click on the dataflle logo to reference the data DATA ETE file $61S103 $166 $168 $80 $51 130 $77 $78 $60 $20 $73 $50 S110 $21$60 $49 63 $91S272 $58S54$40 $47 $24$57 $78...
those pictures are for the one question, please answer all of
them. Thanks!
A start-up company's ability to gain funding is a key to success. The amount of funds raised (in millions of dollars) for fifty hot start-up companies follow (source: Wail Street Journal, March 10, 2011). Click on the dataflle logo to reference the data DATA ETE file $61S103 $166 $168 $80 $51 130 $77 $78 $60 $20 $73 $50 S110 $21$60 $49 63 $91S272 $58S54$40 $47 $24$57 $78...
 A department of transportation's study on driving speed and miles per gallon for midsize automobiles resulted in the following data Speed (Miles per our30 50 40 55 30 24 60 25 51 55 Miles per Gallon 28 24 24 23 30 32 21 35 26 25 Compute the sample correlation coefficient (to 2 decimals and enter negative value as negative number) What can you conclude, based on your computation of the sample correlation coefficient? - Select your answer- Select the...
 A department of transportation's study on driving speed and miles per gallon for midsize automobiles resulted in the following data: Speed (Miles per Hour) 30 50 40 55 30 24 60 24 51 56 Miles per Gallon 28 24 24 22 30 33 21 Compute the sample correlation coefficient (to 2 decimals and enter negative value as negative number). 35 26 24 What can you conclude, based on your computation of the sample correlation coefficient? - Select your answer -...
 Those questions are for the same question, please answer all of
them. Thanks~
eBook Each year America.EDU ranks the best paying college degrees In America. The followlng data show the medlan starting salary, the mld-career salary, and the percentage Increase from starting salary to mld career salary for the 20 college degrees with the highest mid-career salary (America.EDU website, August 29, 2013) Click on the datafile logo to reference the data DATA file Starting Salary Mid-Career Salary %Increase Aerospace engineering...
Those questions are for the same question, please answer all of
them. Thanks~
eBook Each year America.EDU ranks the best paying college degrees In America. The followlng data show the medlan starting salary, the mld-career salary, and the percentage Increase from starting salary to mld career salary for the 20 college degrees with the highest mid-career salary (America.EDU website, August 29, 2013) Click on the datafile logo to reference the data DATA file Starting Salary Mid-Career Salary %Increase Aerospace engineering...
 Answer the question on the basis of the following five data sets, wherein it is assumed that the variable shown on the left is the independent variable and the one on the right is the dependent variable. Assume in graphing these data that the independent variable is shown on the horizontal axis and the dependent variable on the vertical axis 3) 0 -15 100 40 15 25 0 1e 5 1e 35 10 20 120 40 9 15 40 70...
Most questions answered within 3 hours.
-
For the reaction CaI2+2AgNO3⟶2AgI+Ca(NO3)2 how many grams of
silver iodide, AgI, are produced from 56.5 g...
asked 6 minutes ago -
Write an equation for hydrolysis via acid catalysis.
Using ethyl acetate, ethyl benzoate, ethyl formate or...
asked 14 minutes ago -
Only one graph is needed.
(a) Draw a Supply Curve and the Demand Curve for the...
asked 17 minutes ago -
Fill in the blanks and please show how you arrived at numerical
answers
. The...
asked 17 minutes ago -
91. If the half – life of a sample of radioactive
material is 60 days, what...
asked 24 minutes ago -
White light (380nm-750nm) strikes a diffraction grating (420
lines/mm) at normal incidence. What is the highest-order...
asked 34 minutes ago -
1) Explain what is meant by a good being "excludable."?
2) Explain what is meant by...
asked 33 minutes ago -
I need help with this question:
Describe in detail at least two factors that stimulated American...
asked 40 minutes ago -
Calculate the Boyle temperature for helium assuming it follows
the Berthelot equation of state.
asked 41 minutes ago -
Summarize Strategic Corporate Social Responsibility, 4th edition
2017 book, chapter one and two.
asked 41 minutes ago -
1. If the standard deviations for return on stock A and stock B
are 28% and...
asked 56 minutes ago -
Please use python to explain.
Assume that the variables x and
y refer to strings. Write...
asked 1 hour ago