those pictures are for the one question, please answer all of them. Thanks!
Homework Answers
a 1
b 2
c side by side is better bar chart to prensent data
reason -
1 it is easy to estimate values because every value is independently determined.
2. Stacked bar adds previous figures that makes difficult for valuation .
Add Answer to:
those pictures are for the one question, please answer all of
them. Thanks!
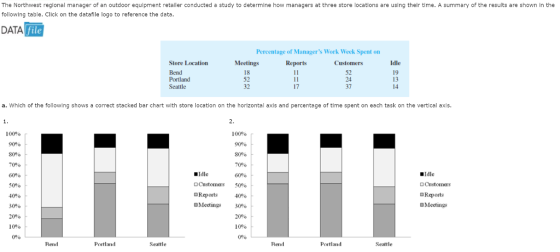
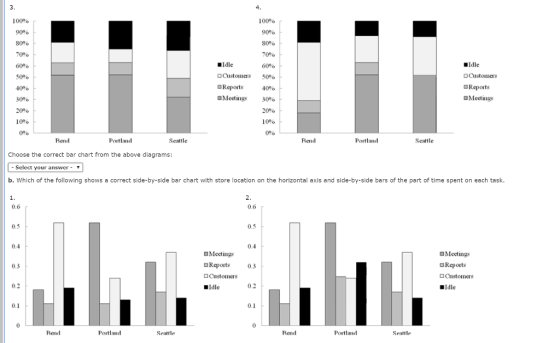
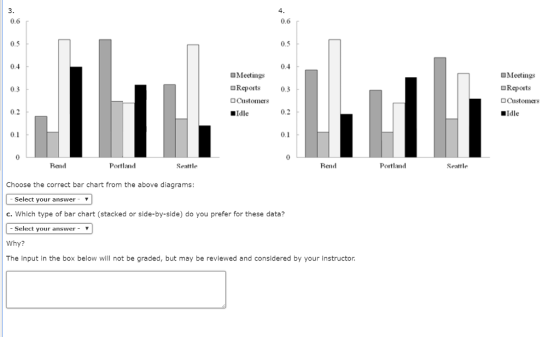
The Northwest reglonal...
those pictures are for the one question, please answer all of them. Thanks! eBook Consider the...
 those pictures are for the one question, please answer all of
them. Thanks!
eBook Consider the following data on two categorical variables. The first variable which each combination occurs. can take on values A, B, C or D. The second variable, y can take on values I or II. The following table gives the frequency with Excel File: data02-37.xlsx 143 857 321 420 679 580 a. Select a correct side-by-side bar chart with as the horizontal variable 800 700 500...
those pictures are for the one question, please answer all of
them. Thanks!
eBook Consider the following data on two categorical variables. The first variable which each combination occurs. can take on values A, B, C or D. The second variable, y can take on values I or II. The following table gives the frequency with Excel File: data02-37.xlsx 143 857 321 420 679 580 a. Select a correct side-by-side bar chart with as the horizontal variable 800 700 500...
those pictures are for the one question, please answer all of them. Thanks! A study on...
 those pictures are for the one question, please answer all of
them. Thanks!
A study on driving speed (miles per hour) and fuel efficiency (miles per gallon) for midsize automobiles resulted in the following data Click on the datafile logo to reference the data DATA file Driving Speed Fuel Efficiency 30 50 40 55 30 25 60 25 50 55 28 25 25 23 30 32 21 35 26 25 a. Which of the following is a scatter diagram with...
those pictures are for the one question, please answer all of
them. Thanks!
A study on driving speed (miles per hour) and fuel efficiency (miles per gallon) for midsize automobiles resulted in the following data Click on the datafile logo to reference the data DATA file Driving Speed Fuel Efficiency 30 50 40 55 30 25 60 25 50 55 28 25 25 23 30 32 21 35 26 25 a. Which of the following is a scatter diagram with...
Those questions are for the same question, please answer all of them. Thanks~ eBook Each year...
 Those questions are for the same question, please answer all of
them. Thanks~
eBook Each year America.EDU ranks the best paying college degrees In America. The followlng data show the medlan starting salary, the mld-career salary, and the percentage Increase from starting salary to mld career salary for the 20 college degrees with the highest mid-career salary (America.EDU website, August 29, 2013) Click on the datafile logo to reference the data DATA file Starting Salary Mid-Career Salary %Increase Aerospace engineering...
Those questions are for the same question, please answer all of
them. Thanks~
eBook Each year America.EDU ranks the best paying college degrees In America. The followlng data show the medlan starting salary, the mld-career salary, and the percentage Increase from starting salary to mld career salary for the 20 college degrees with the highest mid-career salary (America.EDU website, August 29, 2013) Click on the datafile logo to reference the data DATA file Starting Salary Mid-Career Salary %Increase Aerospace engineering...
those pictures are for the one question, please answer all of them. Thanks! A start-up company's...
 those pictures are for the one question, please answer all of
them. Thanks!
A start-up company's ability to gain funding is a key to success. The amount of funds raised (in millions of dollars) for fifty hot start-up companies follow (source: Wail Street Journal, March 10, 2011). Click on the dataflle logo to reference the data DATA ETE file $61S103 $166 $168 $80 $51 130 $77 $78 $60 $20 $73 $50 S110 $21$60 $49 63 $91S272 $58S54$40 $47 $24$57 $78...
those pictures are for the one question, please answer all of
them. Thanks!
A start-up company's ability to gain funding is a key to success. The amount of funds raised (in millions of dollars) for fifty hot start-up companies follow (source: Wail Street Journal, March 10, 2011). Click on the dataflle logo to reference the data DATA ETE file $61S103 $166 $168 $80 $51 130 $77 $78 $60 $20 $73 $50 S110 $21$60 $49 63 $91S272 $58S54$40 $47 $24$57 $78...
those pictures are for the one question, please answer all of them. Thanks! eBook Each year...
 those pictures are for the one question, please answer all of
them. Thanks!
eBook Each year Forbes ranks the world's most valuable brands. A portion of the data for 82 of the brands in the 2013 Forbes list is shown in Table 2.12 (Forbes website, February, 2014), The data set includes the following varlables: The name of the brand The type of Industry assoclated with the brand, labeled Automotive & LuxuryY, Consumer Packaged Goods, Financial Services, Other, Technology A measure...
those pictures are for the one question, please answer all of
them. Thanks!
eBook Each year Forbes ranks the world's most valuable brands. A portion of the data for 82 of the brands in the 2013 Forbes list is shown in Table 2.12 (Forbes website, February, 2014), The data set includes the following varlables: The name of the brand The type of Industry assoclated with the brand, labeled Automotive & LuxuryY, Consumer Packaged Goods, Financial Services, Other, Technology A measure...
Demand Schedule for Rocky Road Bus Company: Bus Fare Passengers Total Revenue ARC Elasticity of Demand...
Demand Schedule for Rocky Road Bus Company: Bus Fare Passengers Total Revenue ARC Elasticity of Demand $1.00 0 0.9 10 0.8 20 0.7 30 0.6 40 0.5 50 0.4 60 0.3 70 0.2 80 0.1 90 0 100 1) Calculate the total revenue earned by Rocky Road at each price. 2) Please show work and Calculate the arc elasticities of demand. 3) What bus fare should Rocky Road charge in order to maximize its revenues?
the above question must be solved using the supplied viscosity table. but I keep getting weird values. can I ple...
 the above question must be solved using the supplied
viscosity table. but I keep getting weird values.
can I please have workings and explanation as how to use this table
please.
thank you
Question 3 (3 Marks) Consider a journal bearing with the following characteristics: . Radius of 0.02m A clearance of 0.1mm . .A length of 0.02m Running under the following conditions: .Using SAE40 oil for lubrication . Running at 50 rps . Subject to a load of 100N...
the above question must be solved using the supplied
viscosity table. but I keep getting weird values.
can I please have workings and explanation as how to use this table
please.
thank you
Question 3 (3 Marks) Consider a journal bearing with the following characteristics: . Radius of 0.02m A clearance of 0.1mm . .A length of 0.02m Running under the following conditions: .Using SAE40 oil for lubrication . Running at 50 rps . Subject to a load of 100N...
please answer question asap....thanks NaNO3 Сасі, KNO3 KCr2O7 Solubility (g of salt in 100 g H20)...
 please answer question asap....thanks
NaNO3 Сасі, KNO3 KCr2O7 Solubility (g of salt in 100 g H20) Pb(NO3)2 KCI NaCl KCIO3 0 Cez(SO23 10 20 30 40 50 60 70 80 90 100 Temperature (°C) Based on the associated solubility chart, at what temperature would you need to heat a solution of KCl to dissolve 60.0 g of KCl in 120.0 g of H2O?
please answer question asap....thanks
NaNO3 Сасі, KNO3 KCr2O7 Solubility (g of salt in 100 g H20) Pb(NO3)2 KCI NaCl KCIO3 0 Cez(SO23 10 20 30 40 50 60 70 80 90 100 Temperature (°C) Based on the associated solubility chart, at what temperature would you need to heat a solution of KCl to dissolve 60.0 g of KCl in 120.0 g of H2O?
choose correct answer. i think its the last one im not sure. Use the chart shown...
 choose correct answer. i think its the last one im not
sure.
Use the chart shown to answer the question. What does curve 3 represent? Distribution of Income 100 90 80 70 50 40 30 20 10 0 0 20 40 60 80 100 Percentage of HH 1 2 3 the bottom quintile earning 50% of total income a completely inequal distribution of income the top quintile earning 40% of total income a completely equal distribution of income Percentage of...
choose correct answer. i think its the last one im not
sure.
Use the chart shown to answer the question. What does curve 3 represent? Distribution of Income 100 90 80 70 50 40 30 20 10 0 0 20 40 60 80 100 Percentage of HH 1 2 3 the bottom quintile earning 50% of total income a completely inequal distribution of income the top quintile earning 40% of total income a completely equal distribution of income Percentage of...
the question also says to use snell's law to find the ratio. but i am kind...
 the
question also says to use snell's law to find the ratio. but i am
kind of confused as to how to do this using the graph and line of
best fit. please help..!
8. Submit, along with this report file, a scatter plot of sin 02 as a function of sino 1 0.9 0.8 0.7 0.6 Sin theta 2 0.5 0.4 0.3 0.2 0.1 0 0 0.2 y = 0.2442x + 0.2471 0.4 0.8 1 1.2 0.6 Sin theta...
the
question also says to use snell's law to find the ratio. but i am
kind of confused as to how to do this using the graph and line of
best fit. please help..!
8. Submit, along with this report file, a scatter plot of sin 02 as a function of sino 1 0.9 0.8 0.7 0.6 Sin theta 2 0.5 0.4 0.3 0.2 0.1 0 0 0.2 y = 0.2442x + 0.2471 0.4 0.8 1 1.2 0.6 Sin theta...
 those pictures are for the one question, please answer all of
them. Thanks!
eBook Consider the following data on two categorical variables. The first variable which each combination occurs. can take on values A, B, C or D. The second variable, y can take on values I or II. The following table gives the frequency with Excel File: data02-37.xlsx 143 857 321 420 679 580 a. Select a correct side-by-side bar chart with as the horizontal variable 800 700 500...
those pictures are for the one question, please answer all of
them. Thanks!
eBook Consider the following data on two categorical variables. The first variable which each combination occurs. can take on values A, B, C or D. The second variable, y can take on values I or II. The following table gives the frequency with Excel File: data02-37.xlsx 143 857 321 420 679 580 a. Select a correct side-by-side bar chart with as the horizontal variable 800 700 500...
 those pictures are for the one question, please answer all of
them. Thanks!
A study on driving speed (miles per hour) and fuel efficiency (miles per gallon) for midsize automobiles resulted in the following data Click on the datafile logo to reference the data DATA file Driving Speed Fuel Efficiency 30 50 40 55 30 25 60 25 50 55 28 25 25 23 30 32 21 35 26 25 a. Which of the following is a scatter diagram with...
those pictures are for the one question, please answer all of
them. Thanks!
A study on driving speed (miles per hour) and fuel efficiency (miles per gallon) for midsize automobiles resulted in the following data Click on the datafile logo to reference the data DATA file Driving Speed Fuel Efficiency 30 50 40 55 30 25 60 25 50 55 28 25 25 23 30 32 21 35 26 25 a. Which of the following is a scatter diagram with...
 Those questions are for the same question, please answer all of
them. Thanks~
eBook Each year America.EDU ranks the best paying college degrees In America. The followlng data show the medlan starting salary, the mld-career salary, and the percentage Increase from starting salary to mld career salary for the 20 college degrees with the highest mid-career salary (America.EDU website, August 29, 2013) Click on the datafile logo to reference the data DATA file Starting Salary Mid-Career Salary %Increase Aerospace engineering...
Those questions are for the same question, please answer all of
them. Thanks~
eBook Each year America.EDU ranks the best paying college degrees In America. The followlng data show the medlan starting salary, the mld-career salary, and the percentage Increase from starting salary to mld career salary for the 20 college degrees with the highest mid-career salary (America.EDU website, August 29, 2013) Click on the datafile logo to reference the data DATA file Starting Salary Mid-Career Salary %Increase Aerospace engineering...
 those pictures are for the one question, please answer all of
them. Thanks!
A start-up company's ability to gain funding is a key to success. The amount of funds raised (in millions of dollars) for fifty hot start-up companies follow (source: Wail Street Journal, March 10, 2011). Click on the dataflle logo to reference the data DATA ETE file $61S103 $166 $168 $80 $51 130 $77 $78 $60 $20 $73 $50 S110 $21$60 $49 63 $91S272 $58S54$40 $47 $24$57 $78...
those pictures are for the one question, please answer all of
them. Thanks!
A start-up company's ability to gain funding is a key to success. The amount of funds raised (in millions of dollars) for fifty hot start-up companies follow (source: Wail Street Journal, March 10, 2011). Click on the dataflle logo to reference the data DATA ETE file $61S103 $166 $168 $80 $51 130 $77 $78 $60 $20 $73 $50 S110 $21$60 $49 63 $91S272 $58S54$40 $47 $24$57 $78...
 those pictures are for the one question, please answer all of
them. Thanks!
eBook Each year Forbes ranks the world's most valuable brands. A portion of the data for 82 of the brands in the 2013 Forbes list is shown in Table 2.12 (Forbes website, February, 2014), The data set includes the following varlables: The name of the brand The type of Industry assoclated with the brand, labeled Automotive & LuxuryY, Consumer Packaged Goods, Financial Services, Other, Technology A measure...
those pictures are for the one question, please answer all of
them. Thanks!
eBook Each year Forbes ranks the world's most valuable brands. A portion of the data for 82 of the brands in the 2013 Forbes list is shown in Table 2.12 (Forbes website, February, 2014), The data set includes the following varlables: The name of the brand The type of Industry assoclated with the brand, labeled Automotive & LuxuryY, Consumer Packaged Goods, Financial Services, Other, Technology A measure...
 the above question must be solved using the supplied
viscosity table. but I keep getting weird values.
can I please have workings and explanation as how to use this table
please.
thank you
Question 3 (3 Marks) Consider a journal bearing with the following characteristics: . Radius of 0.02m A clearance of 0.1mm . .A length of 0.02m Running under the following conditions: .Using SAE40 oil for lubrication . Running at 50 rps . Subject to a load of 100N...
the above question must be solved using the supplied
viscosity table. but I keep getting weird values.
can I please have workings and explanation as how to use this table
please.
thank you
Question 3 (3 Marks) Consider a journal bearing with the following characteristics: . Radius of 0.02m A clearance of 0.1mm . .A length of 0.02m Running under the following conditions: .Using SAE40 oil for lubrication . Running at 50 rps . Subject to a load of 100N...
 please answer question asap....thanks
NaNO3 Сасі, KNO3 KCr2O7 Solubility (g of salt in 100 g H20) Pb(NO3)2 KCI NaCl KCIO3 0 Cez(SO23 10 20 30 40 50 60 70 80 90 100 Temperature (°C) Based on the associated solubility chart, at what temperature would you need to heat a solution of KCl to dissolve 60.0 g of KCl in 120.0 g of H2O?
please answer question asap....thanks
NaNO3 Сасі, KNO3 KCr2O7 Solubility (g of salt in 100 g H20) Pb(NO3)2 KCI NaCl KCIO3 0 Cez(SO23 10 20 30 40 50 60 70 80 90 100 Temperature (°C) Based on the associated solubility chart, at what temperature would you need to heat a solution of KCl to dissolve 60.0 g of KCl in 120.0 g of H2O?
 choose correct answer. i think its the last one im not
sure.
Use the chart shown to answer the question. What does curve 3 represent? Distribution of Income 100 90 80 70 50 40 30 20 10 0 0 20 40 60 80 100 Percentage of HH 1 2 3 the bottom quintile earning 50% of total income a completely inequal distribution of income the top quintile earning 40% of total income a completely equal distribution of income Percentage of...
choose correct answer. i think its the last one im not
sure.
Use the chart shown to answer the question. What does curve 3 represent? Distribution of Income 100 90 80 70 50 40 30 20 10 0 0 20 40 60 80 100 Percentage of HH 1 2 3 the bottom quintile earning 50% of total income a completely inequal distribution of income the top quintile earning 40% of total income a completely equal distribution of income Percentage of...
 the
question also says to use snell's law to find the ratio. but i am
kind of confused as to how to do this using the graph and line of
best fit. please help..!
8. Submit, along with this report file, a scatter plot of sin 02 as a function of sino 1 0.9 0.8 0.7 0.6 Sin theta 2 0.5 0.4 0.3 0.2 0.1 0 0 0.2 y = 0.2442x + 0.2471 0.4 0.8 1 1.2 0.6 Sin theta...
the
question also says to use snell's law to find the ratio. but i am
kind of confused as to how to do this using the graph and line of
best fit. please help..!
8. Submit, along with this report file, a scatter plot of sin 02 as a function of sino 1 0.9 0.8 0.7 0.6 Sin theta 2 0.5 0.4 0.3 0.2 0.1 0 0 0.2 y = 0.2442x + 0.2471 0.4 0.8 1 1.2 0.6 Sin theta...
Most questions answered within 3 hours.
-
While rotating the tires on your car you notice a rock [mass =
0.1 Kg] stuck...
asked 28 minutes ago -
Using MARS simulator, write MIPS programs according to
the following scenarios: Receive a positive integer number...
asked 2 hours ago -
An object in front of a concave mirror has a real image that is
11.5 cm...
asked 2 hours ago -
Consider the reaction, C3 H8 + O2 --> CO2 + H2O. How many
moles of O2...
asked 4 hours ago -
You and your opponent both roll a fair die. If you both roll the
same number,...
asked 4 hours ago -
In a study of the accuracy of fast food drive-through orders,
Restaurant A had 257 accurate...
asked 4 hours ago -
Identify and describe in detail the four categories of
institutions that could be included in a...
asked 4 hours ago -
In python
class Customer:
def __init__(self, customer_id, last_name, first_name, phone_number, address):
self._customer_id = int(customer_id)
self._last_name =...
asked 4 hours ago -
What is an example of a limitation in implementing a new
ERP system and how it...
asked 4 hours ago -
In a section of 9.7cm of an artery with a radius of 2.6mm there
is a...
asked 4 hours ago -
the two carboxylic acid groups of aspartic acid have different
acidities with pKa values of 2.1...
asked 4 hours ago -
Would CuCO3 aqueous salt combined with calcium chloride
form a solid precipitate? If so, what would...
asked 4 hours ago