

those pictures are for the one question, please answer all of them. Thanks!
Homework Answers
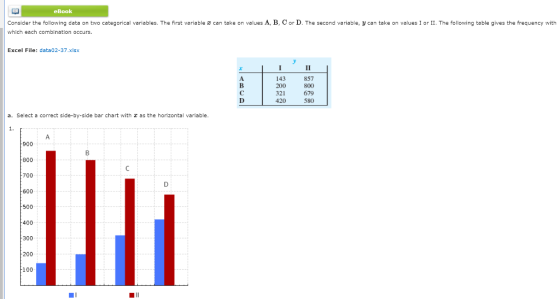
(a) The correct bar-graph is 1. All other shows incorrect bars of the catagories.
(b) As the frequency shows the repetition of the combinations of x and y, we may say, for example, that x-A and y-I occurs 143 times, and so on. As we move in x from A to D, we see that the y-I category increases, while y-II category decreases. Also, the deviation between y-I and y-II decreases, and both category tends to be equal in frequency. Hence, we may say that as we move from A to D in x, y-I category is increasing and -II category is decreasing, and that their deviation is decreasing.
Add Answer to:
those pictures are for the one question, please answer all of them. Thanks! eBook Consider the...
Total costs in the table are: Select one: a. decreasing at a decreasing rate. b. decreasing...
Total costs in the table are: Select one: a. decreasing at a decreasing rate. b. decreasing at a constant rate. c. increasing at a constant rate. d. increasing at an increasing rate. | M Control variable e 0 Total Benefits B(Q) arginal Benefit MB(Q) Marginal Cost MC(Q) Marginal Net Benefit MNB(Q) 0 900 1,700 100 200 Total Costs C(Q) 0 100 300 600 1,000 1,500 2,100 2,800 B 4,500 5,500 Net Benefits N(Q) 0 800 C 1,800 2,000 2,000 1,800...
those pictures are for the one question, please answer all of them. Thanks! The Northwest reglonal...
 those pictures are for the one question, please answer all of
them. Thanks!
The Northwest reglonal manager of an outdoor equipment retaller conducted a study to determine how managers at three store locations are using thelr time. A summary of the results are shown In the following table. Cllck on the dataflle logo to reference the data DATA file Percentage of Manager's Work Week Spent on Store Location Bend Seattle Meetings 18 52 32 Reports Customers Idle 52 24 37...
those pictures are for the one question, please answer all of
them. Thanks!
The Northwest reglonal manager of an outdoor equipment retaller conducted a study to determine how managers at three store locations are using thelr time. A summary of the results are shown In the following table. Cllck on the dataflle logo to reference the data DATA file Percentage of Manager's Work Week Spent on Store Location Bend Seattle Meetings 18 52 32 Reports Customers Idle 52 24 37...
ECON! PLEASE HELP ME d) ! Question 4 [39 points If the goverment expenditure is 40...
 ECON! PLEASE HELP ME d) !
Question 4 [39 points If the goverment expenditure is 40 and the net tax rate is 10.2: a) Compute the following table: G BBNT-G 100 200 NT = LY 20 40 300 500 600 700 100 120 140 100 b) On the following graph plot goverment expenditure and the net tax functions: - Goverment expenditure + + + NT, G ++++++++++++ (900,40) 0 Reset 100 200 300 400 500 600 700 800 c) Given...
ECON! PLEASE HELP ME d) !
Question 4 [39 points If the goverment expenditure is 40 and the net tax rate is 10.2: a) Compute the following table: G BBNT-G 100 200 NT = LY 20 40 300 500 600 700 100 120 140 100 b) On the following graph plot goverment expenditure and the net tax functions: - Goverment expenditure + + + NT, G ++++++++++++ (900,40) 0 Reset 100 200 300 400 500 600 700 800 c) Given...
With reference to the Keynesian theory, if real GDP were $500 and government expenditure increased by...
With reference to the Keynesian theory, if real GDP were $500 and government expenditure increased by $80, what would be the new real GDP? No information on multiplier was provided with this question. Expenditure (E) Possible equilibrium points E=Y 1000 900 800 C+I+G+NX 700 600 500 400 300 200 100 0 100 200 300 400 500 600 700 800 900 1000 GDP (Y)
Please answer question 4 to question 7. DEMAND/SUPPLY SCHEDULE 1 DEMAND/SUPPLY SCHEDULE 2 &nbs
Please answer question 4 to question 7. DEMAND/SUPPLY SCHEDULE 1 DEMAND/SUPPLY SCHEDULE 2 Price Qd Qs Qd + 200 (at each price) Qs + 200 (at each price) $50 200 800 400 1000 $45 300 700 500 900 $40 400 600 600 800 $35 500 500 700 700 $30 600 400 800 600 $25 700 300 900 500 $20 800 200 1000 400 Assume a price floor of $45 in Schedule 1; what is the result? Assume a price ceiling...
What is the marginal net benefit associated with producing five units of the control variable, Q...
 What is the marginal net benefit associated with producing five
units of the control variable, Q (identify point F in the
table)?
Net Marginal Marginal Marginal Net Total variable | Benefits CostsBenefits Benefit c(Q) Contro.1 Total Cost Benefit B(Q) N(Q) MB(Q) MC (Q) MNB (Q) 800 600 400 200 100 900 800 700 600 500 800 100 300 600 1,000 1,500 2,100 2,800 900 1,700 2,400 200 2 1,800 2,000 2,000 1,800 1,400 800 400 500 600 700 800 900...
What is the marginal net benefit associated with producing five
units of the control variable, Q (identify point F in the
table)?
Net Marginal Marginal Marginal Net Total variable | Benefits CostsBenefits Benefit c(Q) Contro.1 Total Cost Benefit B(Q) N(Q) MB(Q) MC (Q) MNB (Q) 800 600 400 200 100 900 800 700 600 500 800 100 300 600 1,000 1,500 2,100 2,800 900 1,700 2,400 200 2 1,800 2,000 2,000 1,800 1,400 800 400 500 600 700 800 900...
With reference to the Keynesian theory and cross graph, if the real GDP were initially $900,...
With reference to the Keynesian theory and cross graph, if the real GDP were initially $900, what would tend to happen to consumption expenditure? How would it change and why would it change? Why would it stop changing? Expenditure (E) Possible equilibrium points E=Y 1000 900 800 C+I+G+NX 700 600 500 400 300 200 100 0 100 200 300 400 500 600 700 800 900 1000 GDP (Y)
those pictures are for the one question, please answer all of them. Thanks! We were unable...
 those pictures are for the one question, please answer all of
them. Thanks!
We were unable to transcribe this imageb. Combine or aggregate the data for the junior and senior years into one crosstabulation as follows: Combined 2-Year Batting A. Fealey Outcome Hit No Hit Total At Bats Calculate each player's batting average for the combined two years. E. Janson Junior/Senior Years Allison Fealey Emily Janson Which player should be awarded the scholarship? Select your answerY Explain. The input in...
those pictures are for the one question, please answer all of
them. Thanks!
We were unable to transcribe this imageb. Combine or aggregate the data for the junior and senior years into one crosstabulation as follows: Combined 2-Year Batting A. Fealey Outcome Hit No Hit Total At Bats Calculate each player's batting average for the combined two years. E. Janson Junior/Senior Years Allison Fealey Emily Janson Which player should be awarded the scholarship? Select your answerY Explain. The input in...
Consider the following table showing aggregate consumption expenditures and disposable income. All values are expressed in...
 Consider the following table showing aggregate consumption expenditures and disposable income. All values are expressed in billions of constant dollars. a. Compute desired saving at each level of disposable income. (Round your responses to the nearest whole number.) 50- Disposable Income (Y) Desired Consumption (C) NUL Savings 100 200 300 400 5 0 600 700 800 100 180 Savings (5) -50/ 260 100 200 300 400 500 600 340 420 500 580 Click the graph, choose a tool in the...
QUESTION 51 od Marginal benefit of individual polluter $1,000 900 Firma 800 700 600 Firm 500...
 QUESTION 51 od Marginal benefit of individual polluter $1,000 900 Firma 800 700 600 Firm 500 400 300 Firm 200 100 100 200 300 400 500 600 700 800 1.000 Quantity of mercury (tons) The figure above shows three different polluting firms. Let's assume the government imposes a $300 tax on each ton of emission. Based on that, how much pollution will Firm B have? O 200 0 O 500 Oo O 1,000
 those pictures are for the one question, please answer all of
them. Thanks!
The Northwest reglonal manager of an outdoor equipment retaller conducted a study to determine how managers at three store locations are using thelr time. A summary of the results are shown In the following table. Cllck on the dataflle logo to reference the data DATA file Percentage of Manager's Work Week Spent on Store Location Bend Seattle Meetings 18 52 32 Reports Customers Idle 52 24 37...
those pictures are for the one question, please answer all of
them. Thanks!
The Northwest reglonal manager of an outdoor equipment retaller conducted a study to determine how managers at three store locations are using thelr time. A summary of the results are shown In the following table. Cllck on the dataflle logo to reference the data DATA file Percentage of Manager's Work Week Spent on Store Location Bend Seattle Meetings 18 52 32 Reports Customers Idle 52 24 37...
 ECON! PLEASE HELP ME d) !
Question 4 [39 points If the goverment expenditure is 40 and the net tax rate is 10.2: a) Compute the following table: G BBNT-G 100 200 NT = LY 20 40 300 500 600 700 100 120 140 100 b) On the following graph plot goverment expenditure and the net tax functions: - Goverment expenditure + + + NT, G ++++++++++++ (900,40) 0 Reset 100 200 300 400 500 600 700 800 c) Given...
ECON! PLEASE HELP ME d) !
Question 4 [39 points If the goverment expenditure is 40 and the net tax rate is 10.2: a) Compute the following table: G BBNT-G 100 200 NT = LY 20 40 300 500 600 700 100 120 140 100 b) On the following graph plot goverment expenditure and the net tax functions: - Goverment expenditure + + + NT, G ++++++++++++ (900,40) 0 Reset 100 200 300 400 500 600 700 800 c) Given...
 What is the marginal net benefit associated with producing five
units of the control variable, Q (identify point F in the
table)?
Net Marginal Marginal Marginal Net Total variable | Benefits CostsBenefits Benefit c(Q) Contro.1 Total Cost Benefit B(Q) N(Q) MB(Q) MC (Q) MNB (Q) 800 600 400 200 100 900 800 700 600 500 800 100 300 600 1,000 1,500 2,100 2,800 900 1,700 2,400 200 2 1,800 2,000 2,000 1,800 1,400 800 400 500 600 700 800 900...
What is the marginal net benefit associated with producing five
units of the control variable, Q (identify point F in the
table)?
Net Marginal Marginal Marginal Net Total variable | Benefits CostsBenefits Benefit c(Q) Contro.1 Total Cost Benefit B(Q) N(Q) MB(Q) MC (Q) MNB (Q) 800 600 400 200 100 900 800 700 600 500 800 100 300 600 1,000 1,500 2,100 2,800 900 1,700 2,400 200 2 1,800 2,000 2,000 1,800 1,400 800 400 500 600 700 800 900...
 those pictures are for the one question, please answer all of
them. Thanks!
We were unable to transcribe this imageb. Combine or aggregate the data for the junior and senior years into one crosstabulation as follows: Combined 2-Year Batting A. Fealey Outcome Hit No Hit Total At Bats Calculate each player's batting average for the combined two years. E. Janson Junior/Senior Years Allison Fealey Emily Janson Which player should be awarded the scholarship? Select your answerY Explain. The input in...
those pictures are for the one question, please answer all of
them. Thanks!
We were unable to transcribe this imageb. Combine or aggregate the data for the junior and senior years into one crosstabulation as follows: Combined 2-Year Batting A. Fealey Outcome Hit No Hit Total At Bats Calculate each player's batting average for the combined two years. E. Janson Junior/Senior Years Allison Fealey Emily Janson Which player should be awarded the scholarship? Select your answerY Explain. The input in...
 Consider the following table showing aggregate consumption expenditures and disposable income. All values are expressed in billions of constant dollars. a. Compute desired saving at each level of disposable income. (Round your responses to the nearest whole number.) 50- Disposable Income (Y) Desired Consumption (C) NUL Savings 100 200 300 400 5 0 600 700 800 100 180 Savings (5) -50/ 260 100 200 300 400 500 600 340 420 500 580 Click the graph, choose a tool in the...
 QUESTION 51 od Marginal benefit of individual polluter $1,000 900 Firma 800 700 600 Firm 500 400 300 Firm 200 100 100 200 300 400 500 600 700 800 1.000 Quantity of mercury (tons) The figure above shows three different polluting firms. Let's assume the government imposes a $300 tax on each ton of emission. Based on that, how much pollution will Firm B have? O 200 0 O 500 Oo O 1,000
Most questions answered within 3 hours.
-
Programming project in Java:
You are allowed to use the following methods from the
Java API:...
asked 2 minutes ago -
The enthalpy change, ΔH, for a reaction at constant pressure is
defined as:
ΔH = ΔE...
asked 9 minutes ago -
What are the two main reasons for including covariates in ANOVA?
a. 1.) To increase within-group...
asked 10 minutes ago -
There are balls numbered 1, 2, 3, 4, 5, 6, 7 in a box, 2 balls...
asked 1 hour ago -
Based on the mutual fund NAVs below, how many shares will $600
buy you, if you...
asked 1 hour ago -
what effect on total protein concentration would you
expect to see during dehydration? explain your reasoning.
asked 1 hour ago -
You are the operations manager of a firm that uses the
continuous review inventory control system....
asked 5 hours ago -
Cost and fair value data for the trading debt securities of
Wildhorse Company at December 31,...
asked 6 hours ago -
In a population of jaguars, a gene with two alleles encodes the
fur color. Allele B...
asked 7 hours ago -
Two copper wires, one 1.80 times the diameter of the other, have
the same current flowing...
asked 7 hours ago -
9. In 2003 the price of ‘home heating oil’ substantially
increased during the harsh winter. In...
asked 7 hours ago -
Match the key paradoxes of negotiation.
Claiming Value
Sticking by your principles
Sticking with your strategy...
asked 8 hours ago