The table below gives the number of hours ten randomly selected students spent studying and their...
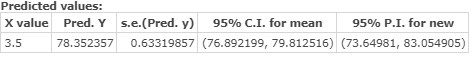
The table below gives the number of hours ten randomly selected students spent studying and their corresponding midterm exam grades. Using this data, consider the equation of the regression line, y ˆ = b 0 + b 1 x y^=b0+b1x , for predicting the midterm exam grade that a student will earn based on the number of hours spent studying. Keep in mind, the correlation coefficient may or may not be statistically significant for the data given. Remember, in practice, it would not be appropriate to use the regression line to make a prediction if the correlation coefficient is not statistically significant. Hours Studying 0.5 1 1.5 2 2.5 3.5 4 4.5 5 6 Midterm Grades 62 64 67 69 71 74 83 86 88 93 Step 4 of 6: Find the estimated value of y when x=3.5 . Round your answer to three decimal places.
Homework Answers
The statistical software output for this problem is:
Hence,
Estimated value of y = 78.352
Add Answer to:
The table below gives the number of hours ten randomly selected
students spent studying and their...
The table below gives the number of hours ten randomly selected students spent studying and their...
The table below gives the number of hours ten randomly selected students spent studying and their corresponding midterm exam grades. Using this data, consider the equation of the regression line, yˆ=b0+b1x, for predicting the midterm exam grade that a student will earn based on the number of hours spent studying. Keep in mind, the correlation coefficient may or may not be statistically significant for the data given. Remember, in practice, it would not be appropriate to use the regression line...
The table below gives the number of hours ten randomly selected students spent studyling and their...
 The table below gives the number of hours ten randomly selected students spent studyling and their corresponding midterm exam grades. Using this data, consider the equation of the regression line, -bo +bix, for predicting the midterm exam grade that a student will earn based on the number of hours spent studying. Keep in mind, the correlation coefficient may or may not be statistically significant for the data given. Remember, in practice, it would not be appropriate to use the regression...
The table below gives the number of hours ten randomly selected students spent studying and their...
The table below gives the number of hours ten randomly selected students spent studying and their corresponding midterm exam grades. Using this data, consider the equation of the regression line, yˆ=b0+b1xy^=b0+b1x, for predicting the midterm exam grade that a student will earn based on the number of hours spent studying. Keep in mind, the correlation coefficient may or may not be statistically significant for the data given. Remember, in practice, it would not be appropriate to use the regression line...
The table below gives the number of hours seven randomly selected students spent studying and their...
The table below gives the number of hours seven randomly selected students spent studying and their corresponding midterm exam grades. Using this data, consider the equation of the regression line, yˆ=b0+b1xy^=b0+b1x, for predicting the midterm exam grade that a student will earn based on the number of hours spent studying. Keep in mind, the correlation coefficient may or may not be statistically significant for the data given. Remember, in practice, it would not be appropriate to use the regression line...
The table below gives the number of hours five randomly selected students spent studying and their...
 The table below gives the number of hours five randomly selected students spent studying and their corresponding midterm exam grades. Using this data, consider the equation of the regression line. Ĵ = bo + bix. for predicting the midterm exam grade that a student will earn based on the number of hours spent studying. Keep in mind, the correlation coefficient may or may not be statistically significant for the data given. Remember, in practice, it would not be appropriate to...
The table below gives the number of hours five randomly selected students spent studying and their...
 The table below gives the number of hours five randomly selected students spent studying and their corresponding midterm exam grades. Using this data, consider the equation of the regression line, y = bo + b x, for predicting the midterm exam grade that a student will earn based on the number of hours spent studying. Keep in mind, the correlation coefficient may or may not be statistically significant for the data given. Remember, in practice, it would not be appropriate...
The table below gives the number of hours ten randomly selected students spent studying and their...
 The table below gives the number of hours ten randomly selected students spent studying and their corresponding midterm exam grades. Using this data, consider the equation of the regression line, y = bo + b1x, for predicting the midterm exam grade that a student will earn based on the number of hours spent studying. Keep in mind, the correlation coefficient may or may not be statistically significant for the data given. Remember, in practice, it would not be appropriate to...
The table below gives the number of hours spent unsupervised each day as well as the...
The table below gives the number of hours spent unsupervised each day as well as the overall grade averages for seven randomly selected middle school students. Using this data, consider the equation of the regression line. y = b0 + b1x. for predicting the overall grade average for a middle school student based on the number of hours spent unsupervised each day. Keep in mind, the correlation coefficient may or may not be statistically significant for the data given. Remember,...
The table below gives the number of hours spent unsupervised each day as well as the...
The table below gives the number of hours spent unsupervised each day as well as the overall grade averages for seven randomly selected middle school students. Using this data, consider the equation of the regression line, y =b0 + b1x for predicting the overall grade average for a middle school student based on the number of hours spent unsupervised each day. Keep in mind, the correlation coefficient may or may not be statistically significant for the data given. Remember, in...
The table below gives the number of hours seven randomly selected students spent studying and their...
 The table below gives the number of hours seven randomly selected students spent studying and their corresponding midterm exam grades. Using this data, consider the equation of the regression line, û = bo + b x, for predicting the midterm exam grade that a student will earn based on the number of hours spent studying. Keep in mind, the correlation coefficient may or may not be statistically significant for the data given. Remember, in practice, it would not be appropriate...
 The table below gives the number of hours ten randomly selected students spent studyling and their corresponding midterm exam grades. Using this data, consider the equation of the regression line, -bo +bix, for predicting the midterm exam grade that a student will earn based on the number of hours spent studying. Keep in mind, the correlation coefficient may or may not be statistically significant for the data given. Remember, in practice, it would not be appropriate to use the regression...
 The table below gives the number of hours five randomly selected students spent studying and their corresponding midterm exam grades. Using this data, consider the equation of the regression line. Ĵ = bo + bix. for predicting the midterm exam grade that a student will earn based on the number of hours spent studying. Keep in mind, the correlation coefficient may or may not be statistically significant for the data given. Remember, in practice, it would not be appropriate to...
 The table below gives the number of hours five randomly selected students spent studying and their corresponding midterm exam grades. Using this data, consider the equation of the regression line, y = bo + b x, for predicting the midterm exam grade that a student will earn based on the number of hours spent studying. Keep in mind, the correlation coefficient may or may not be statistically significant for the data given. Remember, in practice, it would not be appropriate...
 The table below gives the number of hours ten randomly selected students spent studying and their corresponding midterm exam grades. Using this data, consider the equation of the regression line, y = bo + b1x, for predicting the midterm exam grade that a student will earn based on the number of hours spent studying. Keep in mind, the correlation coefficient may or may not be statistically significant for the data given. Remember, in practice, it would not be appropriate to...
 The table below gives the number of hours seven randomly selected students spent studying and their corresponding midterm exam grades. Using this data, consider the equation of the regression line, û = bo + b x, for predicting the midterm exam grade that a student will earn based on the number of hours spent studying. Keep in mind, the correlation coefficient may or may not be statistically significant for the data given. Remember, in practice, it would not be appropriate...
Most questions answered within 3 hours.
-
Let X be a continuous random variable whose PDF is Let X be a
continuous random...
asked 14 minutes ago -
Martinez Company’s relevant range of production is 7,500 units
to 12,500 units. When it produces and...
asked 12 minutes ago -
A football with a mass of 1.2 kg is kicked from ground level to
a height...
asked 17 minutes ago -
Remember: Changes in supply determinants shift supply, and
changes in demand determinants shift demand. We say...
asked 16 minutes ago -
Why is the answer b), for this question? I came up with C) for
my incorrect...
asked 22 minutes ago -
Suppose that you know that in the population of full-time
employees in the United States, the...
asked 44 minutes ago -
This experiment was designed originally to sample various meat and carcass quality
aspects of Ontario pigs...
asked 45 minutes ago -
Dopamine Hydrochloride: draw the structure And Show the
functional groups in different colors and label the...
asked 37 minutes ago -
A rope supports a 10 kg dumbbell hanging from it. What is the
tension in the...
asked 36 minutes ago -
) Raw materials are studied for contamination. Suppose that
the number of particles of contamination per...
asked 59 minutes ago -
After running a regression analysis we calculated an F test and
the significance level was 0.15....
asked 55 minutes ago -
----Can someone please help me solve this one using JAVA
----I thank you in advance
Create...
asked 59 minutes ago