The table below gives the number of hours ten randomly selected students spent studying and their...
The table below gives the number of hours ten randomly selected students spent studying and their corresponding midterm exam grades. Using this data, consider the equation of the regression line, yˆ=b0+b1x, for predicting the midterm exam grade that a student will earn based on the number of hours spent studying. Keep in mind, the correlation coefficient may or may not be statistically significant for the data given. Remember, in practice, it would not be appropriate to use the regression line to make a prediction if the correlation coefficient is not statistically significant.
| Hours Studying | 0 | 0.5 | 1.5 | 2 | 2.5 | 3 | 3.5 | 4 | 4.5 | 5.5 |
|---|---|---|---|---|---|---|---|---|---|---|
| Midterm Grades | 63 | 68 | 72 | 73 | 80 | 84 | 86 | 87 | 94 | 99 |
Step 1 of 6:
Find the estimated slope. Round your answer to three decimal places.
Step 2 of 6:
Find the estimated y-intercept. Round your answer to three decimal places.
Step 3 of 6:
Determine the value of the dependent variable yˆ at x=0. (b0, b1, x or y)
Step 4 of 6:
Find the estimated value of y when x=2.5. Round your answer to three decimal places.
Step 5 of 6:
Substitute the values you found in steps 1 and 2 into the equation for the regression line to find the estimated linear model. According to this model, if the value of the independent variable is increased by one unit, then find the change in the dependent variable yˆ
Step 6 of 6:
Find the value of the coefficient of determination. Round your answer to three decimal places.
Homework Answers
Step 1. 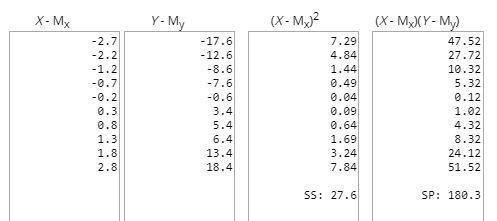
Sum of X = 27
Sum of Y = 806
Mean X = 2.7
Mean Y = 80.6
Sum of squares (SSX) = 27.6
Sum of products (SP) = 180.3
Regression Equation = ŷ = bX + a
b = SP/SSX = 180.3/27.6 =
6.533
Step 2. a = MY - bMX = 80.6 - (6.53*2.7) = 62.962
Step 3: Regression line is
ŷ = 6.533X + 62.962
For x=0, y=62.962
Step 4: For x=2.5, ŷ = (6.533*2.5)+ 62.962=79.295
Step 5: Here we need to find value of y when x changes to 1 and that is value of slope=6.533
Step 6: 
X Values
∑ = 27
Mean = 2.7
∑(X - Mx)2 = SSx = 27.6
Y Values
∑ = 806
Mean = 80.6
∑(Y - My)2 = SSy = 1200.4
X and Y Combined
N = 10
∑(X - Mx)(Y - My) = 180.3
R Calculation
r = ∑((X - My)(Y - Mx)) /
√((SSx)(SSy))
r = 180.3 / √((27.6)(1200.4)) = 0.991
So r^2=0.991^2=0.982
Add Answer to:
The table below gives the number of hours ten randomly selected students spent studying and their...
The table below gives the number of hours ten randomly selected students spent studying and their...
The table below gives the number of hours ten randomly selected students spent studying and their corresponding midterm exam grades. Using this data, consider the equation of the regression line, yˆ=b0+b1xy^=b0+b1x, for predicting the midterm exam grade that a student will earn based on the number of hours spent studying. Keep in mind, the correlation coefficient may or may not be statistically significant for the data given. Remember, in practice, it would not be appropriate to use the regression line...
The table below gives the number of hours seven randomly selected students spent studying and their...
The table below gives the number of hours seven randomly selected students spent studying and their corresponding midterm exam grades. Using this data, consider the equation of the regression line, yˆ=b0+b1xy^=b0+b1x, for predicting the midterm exam grade that a student will earn based on the number of hours spent studying. Keep in mind, the correlation coefficient may or may not be statistically significant for the data given. Remember, in practice, it would not be appropriate to use the regression line...
The table below gives the number of hours ten randomly selected students spent studying and their...
The table below gives the number of hours ten randomly selected students spent studying and their corresponding midterm exam grades. Using this data, consider the equation of the regression line, y ˆ = b 0 + b 1 x y^=b0+b1x , for predicting the midterm exam grade that a student will earn based on the number of hours spent studying. Keep in mind, the correlation coefficient may or may not be statistically significant for the data given. Remember, in practice,...
The table below gives the number of hours ten randomly selected students spent studyling and their...
 The table below gives the number of hours ten randomly selected students spent studyling and their corresponding midterm exam grades. Using this data, consider the equation of the regression line, -bo +bix, for predicting the midterm exam grade that a student will earn based on the number of hours spent studying. Keep in mind, the correlation coefficient may or may not be statistically significant for the data given. Remember, in practice, it would not be appropriate to use the regression...
The table below gives the number of hours five randomly selected students spent studying and their...
 The table below gives the number of hours five randomly selected students spent studying and their corresponding midterm exam grades. Using this data, consider the equation of the regression line, y = bo + b x, for predicting the midterm exam grade that a student will earn based on the number of hours spent studying. Keep in mind, the correlation coefficient may or may not be statistically significant for the data given. Remember, in practice, it would not be appropriate...
The table below gives the number of hours five randomly selected students spent studying and their...
 The table below gives the number of hours five randomly selected students spent studying and their corresponding midterm exam grades. Using this data, consider the equation of the regression line. Ĵ = bo + bix. for predicting the midterm exam grade that a student will earn based on the number of hours spent studying. Keep in mind, the correlation coefficient may or may not be statistically significant for the data given. Remember, in practice, it would not be appropriate to...
The table below gives the number of hours ten randomly selected students spent studying and their...
 The table below gives the number of hours ten randomly selected students spent studying and their corresponding midterm exam grades. Using this data, consider the equation of the regression line, y = bo + b1x, for predicting the midterm exam grade that a student will earn based on the number of hours spent studying. Keep in mind, the correlation coefficient may or may not be statistically significant for the data given. Remember, in practice, it would not be appropriate to...
The table below gives the number of hours seven randomly selected students spent studying and their...
 The table below gives the number of hours seven randomly selected students spent studying and their corresponding midterm exam grades. Using this data, consider the equation of the regression line, û = bo + b x, for predicting the midterm exam grade that a student will earn based on the number of hours spent studying. Keep in mind, the correlation coefficient may or may not be statistically significant for the data given. Remember, in practice, it would not be appropriate...
The table below gives the number of hours spent unsupervised each day as well as the...
The table below gives the number of hours spent unsupervised each day as well as the overall grade averages for seven randomly selected middle school students. Using this data, consider the equation of the regression line, yˆ=b0+b1xy^=b0+b1x, for predicting the overall grade average for a middle school student based on the number of hours spent unsupervised each day. Keep in mind, the correlation coefficient may or may not be statistically significant for the data given. Remember, in practice, it would...
 The table below gives the number of hours ten randomly selected students spent studyling and their corresponding midterm exam grades. Using this data, consider the equation of the regression line, -bo +bix, for predicting the midterm exam grade that a student will earn based on the number of hours spent studying. Keep in mind, the correlation coefficient may or may not be statistically significant for the data given. Remember, in practice, it would not be appropriate to use the regression...
 The table below gives the number of hours five randomly selected students spent studying and their corresponding midterm exam grades. Using this data, consider the equation of the regression line, y = bo + b x, for predicting the midterm exam grade that a student will earn based on the number of hours spent studying. Keep in mind, the correlation coefficient may or may not be statistically significant for the data given. Remember, in practice, it would not be appropriate...
 The table below gives the number of hours five randomly selected students spent studying and their corresponding midterm exam grades. Using this data, consider the equation of the regression line. Ĵ = bo + bix. for predicting the midterm exam grade that a student will earn based on the number of hours spent studying. Keep in mind, the correlation coefficient may or may not be statistically significant for the data given. Remember, in practice, it would not be appropriate to...
 The table below gives the number of hours ten randomly selected students spent studying and their corresponding midterm exam grades. Using this data, consider the equation of the regression line, y = bo + b1x, for predicting the midterm exam grade that a student will earn based on the number of hours spent studying. Keep in mind, the correlation coefficient may or may not be statistically significant for the data given. Remember, in practice, it would not be appropriate to...
 The table below gives the number of hours seven randomly selected students spent studying and their corresponding midterm exam grades. Using this data, consider the equation of the regression line, û = bo + b x, for predicting the midterm exam grade that a student will earn based on the number of hours spent studying. Keep in mind, the correlation coefficient may or may not be statistically significant for the data given. Remember, in practice, it would not be appropriate...
Most questions answered within 3 hours.
-
HELP WITH SAS
Run the following DATA step to create a SAS data set called
ABC_CORP....
asked 3 minutes ago -
A researcher wishes to study the cumulative effects of several
combinations of HIV drugs. There are...
asked 22 minutes ago -
How
to make a simple game of whack a mole in pygame
asked 6 minutes ago -
Write a c/c++ program to read a list of students from a file and
create a...
asked 15 minutes ago -
Identify two different methods for collecting data in
qualitative research. What are the benefits and challenges...
asked 16 minutes ago -
I am suppose to have my array before the main class but I am
getting the...
asked 17 minutes ago -
Your task is to design the page table for the 32bit Pentium
microprocessor. Answer the following...
asked 24 minutes ago -
The Paradise Shoes Company has estimated its weekly TVC function
from data collected over the past...
asked 22 minutes ago -
Although Epicurus advocates pursuing pleasure for the
good life, discuss a few reasons why he does...
asked 40 minutes ago -
Problem 1: Present entries to record the selected transactions
described below:
(a)
Issued $2,790,000 of 5-year,...
asked 46 minutes ago -
Using technology to support HR activities increases:
a.
the efficiency of the administrative HR functions.
b....
asked 47 minutes ago -
1. List the features used to classify leaf
types.
2. List some characteristics that are shared...
asked 52 minutes ago