This is a little long, but I need help figuring it out. I see other questions...
This is a little long, but I need help figuring it out. I see other questions close to this one, but not exactly, so I'm confused.
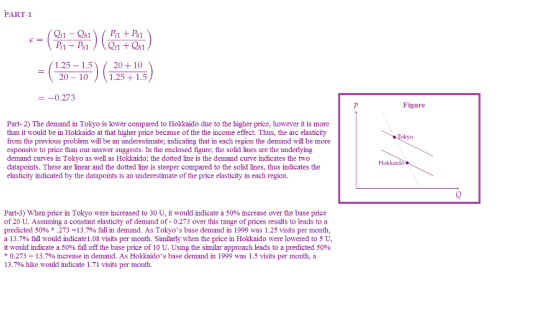
Suppose you are collecting data from a country like Japan where the government sets the price of health care. Each prefecture in Japan has a different set of prices.
-Table 2.2 Outpatient utilization in Tokyo & Hokkaido, 1999
Region: Oupatient visits Price per visit
Tokyo 1.25/month 20 yen
Hokkaido 1.5/month 10 yen
A) What is the arc price elasticity of demand for healthcare consumers in japan?
B) Suppose that incomes are generally much higher in Tokyo than Hokkaido. Is your answer to the last question an overestimate or underestimate of price elasticity? Justify your answer.
C) Using your estimated elasticity, what would the demand for health care be if the price in Tokyo was raised to 30 yen per visit? What would the demand in Hokkaido be ifthe price were lowered to 5 yen per visit?
D) Calculate the price elasticity of demand for health care in Japan using only data from year 2000:
Tokyo 1.0/month 30 yen
Hokkaido 1.2/month 15 yen
E) use data from both years to calculate the elasticity of demand for health care for each city seperately.
F) Using your estimated elasticities, what would the demand for health care in each prefecture be if the price were raised to 60 yen per visit next year for coth cities?
G) Combine the estimates to get a single esti,ate of the price elasticity of health care demand for all of Japan. Assume that Tokyo is 5 times the size of Hokkaido.
***I know this is long, but I do need help and understanding on this. Thank you!!
Homework Answers

Add Answer to:
This is a little long, but I need help figuring it out. I see
other questions...
Need help, YOU DONT HAVE TO DO A OR B. I understand those. Its mainly D...
 Need help, YOU DONT HAVE TO DO A OR B. I understand those. Its
mainly D through G that I have trouble with. Feel free just to do
those.
Suppose you are collecting data from a country like Japan where the government sets the price of health care. Each prefecture in Japan has a different set of prices (for example, Tokyo has higher prices than rural Hokkaido). Data for 1999 is displayed in Table 2.12 11 Table 2.12. Outpatient utilization...
Need help, YOU DONT HAVE TO DO A OR B. I understand those. Its
mainly D through G that I have trouble with. Feel free just to do
those.
Suppose you are collecting data from a country like Japan where the government sets the price of health care. Each prefecture in Japan has a different set of prices (for example, Tokyo has higher prices than rural Hokkaido). Data for 1999 is displayed in Table 2.12 11 Table 2.12. Outpatient utilization...
Suppose you are collecting data from a country like Japan where the government sets the price...
 Suppose you are collecting data from a country like Japan where the government sets the price of health care. Each prefecture in Japan has a different set of prices (for example, Tokyo has higher prices than rural Hokkaido). Data for 2015 is displayed in Table 1. What is the arc price elasticity of demand for health care consumers in Japan (using only this data)? Suppose that incomes are generally much higher in Tokyo than Hokkaido. Is your answer to the...
I have mostly completed this question. Need help on whether or not my work is correct,...
 I have mostly completed this question. Need help on whether or
not my work is correct, and help on blank ones
11. Suppose you are collecting data from a country like Japan
where the government sets the price of health care. Each prefecture
in Japan has a different set of prices (for example,Tokyo has higher
prices than rural Hokkaido).Data for 1999 is displayed in Table
2.12.)
a. What is the arc price elasticity of demand for health care
consumers in...
I have mostly completed this question. Need help on whether or
not my work is correct, and help on blank ones
11. Suppose you are collecting data from a country like Japan
where the government sets the price of health care. Each prefecture
in Japan has a different set of prices (for example,Tokyo has higher
prices than rural Hokkaido).Data for 1999 is displayed in Table
2.12.)
a. What is the arc price elasticity of demand for health care
consumers in...
Need help, please show work Suppose you are collecting data from a country like Japan where...
 Need help, please show work
Suppose you are collecting data from a country like Japan where the government sets the price of health care. Each prefecture in Japan has a different set of prices (for example, Tokyo has higher prices than rural Hokkaido). Data for 1999 is displayed in Table 2.12. 11 Table 2.12. Outpatient utilization in Tokyo and Hokkaido, 1999. RegionOutpatient visits Price/visit Tokyo 1.25/month Hokkaido 1.5/month 20Y 10¥ What is the arc price elasticity of demand for health...
Need help, please show work
Suppose you are collecting data from a country like Japan where the government sets the price of health care. Each prefecture in Japan has a different set of prices (for example, Tokyo has higher prices than rural Hokkaido). Data for 1999 is displayed in Table 2.12. 11 Table 2.12. Outpatient utilization in Tokyo and Hokkaido, 1999. RegionOutpatient visits Price/visit Tokyo 1.25/month Hokkaido 1.5/month 20Y 10¥ What is the arc price elasticity of demand for health...
(12 points) Suppose you are collecting data from a country like Japan where the government sets...
 (12 points) Suppose you are collecting data from a country like Japan where the government sets the price of health care. Each prefecture in Japan has a different set of prices. Data from 1999 are displayed in the following table: Outpatient visits 1 per month 2 per month Price per visit Region Tokyo Hokkaido 25 yen 15 yen a. What is the arc price elasticity of demand for health care in Japan based on these data? b. Suppose that incomes...
I really need help figuring out the Tarif amount and thre revenue it would raise for...
 I really need help figuring out the Tarif amount and thre
revenue it would raise for the Government. This is based on a Micro
Economics 304 question and I could really use some help with the
math. It is a bit to vague for me to figure out on my own, thank
you.
P.S. I really need this figured out by 03/21.
Sooy DOMEST20 DED ODMESTIC SUPPLY Price (pollars per Busher 260- - Pu/world Price) 30 60 90 no 159...
I really need help figuring out the Tarif amount and thre
revenue it would raise for the Government. This is based on a Micro
Economics 304 question and I could really use some help with the
math. It is a bit to vague for me to figure out on my own, thank
you.
P.S. I really need this figured out by 03/21.
Sooy DOMEST20 DED ODMESTIC SUPPLY Price (pollars per Busher 260- - Pu/world Price) 30 60 90 no 159...
How are the elasticities in the below questions different? Beyond the math, why? Recreational marijuana was...
 How
are the elasticities in the below questions different? Beyond the
math, why?
Recreational marijuana was legalized in the state of Washington in July of 2014 creating a new source of revenue for the government. July 1,2015, the state government raised excise taxes paid by marijuana retailers on final sales leading to the following effects on prices and quantity sold: Quantity Sold (average grams per day) Price (per Date gram) 13.18 13.48 13.48 June 2015 (e 310.0 tax change) July...
How
are the elasticities in the below questions different? Beyond the
math, why?
Recreational marijuana was legalized in the state of Washington in July of 2014 creating a new source of revenue for the government. July 1,2015, the state government raised excise taxes paid by marijuana retailers on final sales leading to the following effects on prices and quantity sold: Quantity Sold (average grams per day) Price (per Date gram) 13.18 13.48 13.48 June 2015 (e 310.0 tax change) July...
This is all i was given for the problem. Can anyone help me? Homework Questions: Problem...
 This is all i was given for the problem. Can anyone help me?
Homework Questions: Problem #1: Elasticity. Demand and Sunnly and Modeling Competitive Markets (0 points) One of the more useful applications of an elasticity is the ability to determine supply and dema ply and demand curves using the elasticity and one other point along the demand or supply curve, usually the equilibrium point. This property of elasticities makes them very useful in constructing economic models, because we usually...
This is all i was given for the problem. Can anyone help me?
Homework Questions: Problem #1: Elasticity. Demand and Sunnly and Modeling Competitive Markets (0 points) One of the more useful applications of an elasticity is the ability to determine supply and dema ply and demand curves using the elasticity and one other point along the demand or supply curve, usually the equilibrium point. This property of elasticities makes them very useful in constructing economic models, because we usually...
Hello I need help with questions 2 until question 9 if you can do that for me thanks. I need to s...
 Hello I need help with questions 2 until question 9 if you can do
that for me thanks. I need to see all work and answers clearly.
Thanks for the help I know it’s a lot but I really need help with
this it’s a project that’s due tonight. Thanks !
27 27889.0526471 10.12 1.09 28 SUMMARY OUTPUT 29 30 Regression Statistics 1 Multiple F 0.986442 32 R Square 0.973068 33 Adjusted 0.967681 34 Standard I 32.55341 35 Observati 36...
Hello I need help with questions 2 until question 9 if you can do
that for me thanks. I need to see all work and answers clearly.
Thanks for the help I know it’s a lot but I really need help with
this it’s a project that’s due tonight. Thanks !
27 27889.0526471 10.12 1.09 28 SUMMARY OUTPUT 29 30 Regression Statistics 1 Multiple F 0.986442 32 R Square 0.973068 33 Adjusted 0.967681 34 Standard I 32.55341 35 Observati 36...
Hello I need help with questions 2 until 9 if possible. If you can please show all work and answe...
 Hello I need help with questions 2 until 9 if possible. If you
can please show all work and answers clearly. Thanks for all the
help have this project that’s due tonight so I need help on
thanks.
27 27889.0526471 10.12 1.09 28 SUMMARY OUTPUT 29 30 Regression Statistics 1 Multiple F 0.986442 32 R Square 0.973068 33 Adjusted 0.967681 34 Standard I 32.55341 35 Observati 36 37 ANOVA 38 39 Regressio 40 Residual 41 Total 42 43 44 Intercept...
Hello I need help with questions 2 until 9 if possible. If you
can please show all work and answers clearly. Thanks for all the
help have this project that’s due tonight so I need help on
thanks.
27 27889.0526471 10.12 1.09 28 SUMMARY OUTPUT 29 30 Regression Statistics 1 Multiple F 0.986442 32 R Square 0.973068 33 Adjusted 0.967681 34 Standard I 32.55341 35 Observati 36 37 ANOVA 38 39 Regressio 40 Residual 41 Total 42 43 44 Intercept...
 Need help, YOU DONT HAVE TO DO A OR B. I understand those. Its
mainly D through G that I have trouble with. Feel free just to do
those.
Suppose you are collecting data from a country like Japan where the government sets the price of health care. Each prefecture in Japan has a different set of prices (for example, Tokyo has higher prices than rural Hokkaido). Data for 1999 is displayed in Table 2.12 11 Table 2.12. Outpatient utilization...
Need help, YOU DONT HAVE TO DO A OR B. I understand those. Its
mainly D through G that I have trouble with. Feel free just to do
those.
Suppose you are collecting data from a country like Japan where the government sets the price of health care. Each prefecture in Japan has a different set of prices (for example, Tokyo has higher prices than rural Hokkaido). Data for 1999 is displayed in Table 2.12 11 Table 2.12. Outpatient utilization...
 Suppose you are collecting data from a country like Japan where the government sets the price of health care. Each prefecture in Japan has a different set of prices (for example, Tokyo has higher prices than rural Hokkaido). Data for 2015 is displayed in Table 1. What is the arc price elasticity of demand for health care consumers in Japan (using only this data)? Suppose that incomes are generally much higher in Tokyo than Hokkaido. Is your answer to the...
 I have mostly completed this question. Need help on whether or
not my work is correct, and help on blank ones
11. Suppose you are collecting data from a country like Japan
where the government sets the price of health care. Each prefecture
in Japan has a different set of prices (for example,Tokyo has higher
prices than rural Hokkaido).Data for 1999 is displayed in Table
2.12.)
a. What is the arc price elasticity of demand for health care
consumers in...
I have mostly completed this question. Need help on whether or
not my work is correct, and help on blank ones
11. Suppose you are collecting data from a country like Japan
where the government sets the price of health care. Each prefecture
in Japan has a different set of prices (for example,Tokyo has higher
prices than rural Hokkaido).Data for 1999 is displayed in Table
2.12.)
a. What is the arc price elasticity of demand for health care
consumers in...
 Need help, please show work
Suppose you are collecting data from a country like Japan where the government sets the price of health care. Each prefecture in Japan has a different set of prices (for example, Tokyo has higher prices than rural Hokkaido). Data for 1999 is displayed in Table 2.12. 11 Table 2.12. Outpatient utilization in Tokyo and Hokkaido, 1999. RegionOutpatient visits Price/visit Tokyo 1.25/month Hokkaido 1.5/month 20Y 10¥ What is the arc price elasticity of demand for health...
Need help, please show work
Suppose you are collecting data from a country like Japan where the government sets the price of health care. Each prefecture in Japan has a different set of prices (for example, Tokyo has higher prices than rural Hokkaido). Data for 1999 is displayed in Table 2.12. 11 Table 2.12. Outpatient utilization in Tokyo and Hokkaido, 1999. RegionOutpatient visits Price/visit Tokyo 1.25/month Hokkaido 1.5/month 20Y 10¥ What is the arc price elasticity of demand for health...
 (12 points) Suppose you are collecting data from a country like Japan where the government sets the price of health care. Each prefecture in Japan has a different set of prices. Data from 1999 are displayed in the following table: Outpatient visits 1 per month 2 per month Price per visit Region Tokyo Hokkaido 25 yen 15 yen a. What is the arc price elasticity of demand for health care in Japan based on these data? b. Suppose that incomes...
 I really need help figuring out the Tarif amount and thre
revenue it would raise for the Government. This is based on a Micro
Economics 304 question and I could really use some help with the
math. It is a bit to vague for me to figure out on my own, thank
you.
P.S. I really need this figured out by 03/21.
Sooy DOMEST20 DED ODMESTIC SUPPLY Price (pollars per Busher 260- - Pu/world Price) 30 60 90 no 159...
I really need help figuring out the Tarif amount and thre
revenue it would raise for the Government. This is based on a Micro
Economics 304 question and I could really use some help with the
math. It is a bit to vague for me to figure out on my own, thank
you.
P.S. I really need this figured out by 03/21.
Sooy DOMEST20 DED ODMESTIC SUPPLY Price (pollars per Busher 260- - Pu/world Price) 30 60 90 no 159...
 How
are the elasticities in the below questions different? Beyond the
math, why?
Recreational marijuana was legalized in the state of Washington in July of 2014 creating a new source of revenue for the government. July 1,2015, the state government raised excise taxes paid by marijuana retailers on final sales leading to the following effects on prices and quantity sold: Quantity Sold (average grams per day) Price (per Date gram) 13.18 13.48 13.48 June 2015 (e 310.0 tax change) July...
How
are the elasticities in the below questions different? Beyond the
math, why?
Recreational marijuana was legalized in the state of Washington in July of 2014 creating a new source of revenue for the government. July 1,2015, the state government raised excise taxes paid by marijuana retailers on final sales leading to the following effects on prices and quantity sold: Quantity Sold (average grams per day) Price (per Date gram) 13.18 13.48 13.48 June 2015 (e 310.0 tax change) July...
 This is all i was given for the problem. Can anyone help me?
Homework Questions: Problem #1: Elasticity. Demand and Sunnly and Modeling Competitive Markets (0 points) One of the more useful applications of an elasticity is the ability to determine supply and dema ply and demand curves using the elasticity and one other point along the demand or supply curve, usually the equilibrium point. This property of elasticities makes them very useful in constructing economic models, because we usually...
This is all i was given for the problem. Can anyone help me?
Homework Questions: Problem #1: Elasticity. Demand and Sunnly and Modeling Competitive Markets (0 points) One of the more useful applications of an elasticity is the ability to determine supply and dema ply and demand curves using the elasticity and one other point along the demand or supply curve, usually the equilibrium point. This property of elasticities makes them very useful in constructing economic models, because we usually...
 Hello I need help with questions 2 until question 9 if you can do
that for me thanks. I need to see all work and answers clearly.
Thanks for the help I know it’s a lot but I really need help with
this it’s a project that’s due tonight. Thanks !
27 27889.0526471 10.12 1.09 28 SUMMARY OUTPUT 29 30 Regression Statistics 1 Multiple F 0.986442 32 R Square 0.973068 33 Adjusted 0.967681 34 Standard I 32.55341 35 Observati 36...
Hello I need help with questions 2 until question 9 if you can do
that for me thanks. I need to see all work and answers clearly.
Thanks for the help I know it’s a lot but I really need help with
this it’s a project that’s due tonight. Thanks !
27 27889.0526471 10.12 1.09 28 SUMMARY OUTPUT 29 30 Regression Statistics 1 Multiple F 0.986442 32 R Square 0.973068 33 Adjusted 0.967681 34 Standard I 32.55341 35 Observati 36...
 Hello I need help with questions 2 until 9 if possible. If you
can please show all work and answers clearly. Thanks for all the
help have this project that’s due tonight so I need help on
thanks.
27 27889.0526471 10.12 1.09 28 SUMMARY OUTPUT 29 30 Regression Statistics 1 Multiple F 0.986442 32 R Square 0.973068 33 Adjusted 0.967681 34 Standard I 32.55341 35 Observati 36 37 ANOVA 38 39 Regressio 40 Residual 41 Total 42 43 44 Intercept...
Hello I need help with questions 2 until 9 if possible. If you
can please show all work and answers clearly. Thanks for all the
help have this project that’s due tonight so I need help on
thanks.
27 27889.0526471 10.12 1.09 28 SUMMARY OUTPUT 29 30 Regression Statistics 1 Multiple F 0.986442 32 R Square 0.973068 33 Adjusted 0.967681 34 Standard I 32.55341 35 Observati 36 37 ANOVA 38 39 Regressio 40 Residual 41 Total 42 43 44 Intercept...
Most questions answered within 3 hours.
-
The extent to which assets are financed by borrowed funds and
other liabilities is indicated by:...
asked 46 minutes ago -
Explain in detail
Germany is the fifth largest economy
explain what goods and services Germany specializes...
asked 1 hour ago -
The density of platinum is 21.45 g/mL. If a cube of platinum
with a mass of...
asked 1 hour ago -
Accounts Receivable
Sales
A/R Posting
Extended Sales Invoice
Packing Slip
Compare invoice to packing slip 2...
asked 1 hour ago -
Michaella, age 23, is a full-time law student and is claimed by
her parents as a...
asked 1 hour ago -
Why are polymers not typically casted into products?
asked 1 hour ago -
When rolling a die 129 times, what is the probability of rolling
a 6 no more...
asked 1 hour ago -
4. A call option currently sells for $7.75. It has a strike
price of $85 and...
asked 1 hour ago -
1.
You need to prepare 10.0 liters of an acid aqueous solution with a
pH of...
asked 1 hour ago -
Along an aggregate supply curve, if the level of output is less
than the natural level...
asked 1 hour ago -
By 2025, annual consumption in emerging markets will total $30
trillion and contribute more than ________...
asked 1 hour ago -
At what point does reformation cease to be a viable option for
those who are oppressed...
asked 1 hour ago