
Homework Answers
Add Answer to:
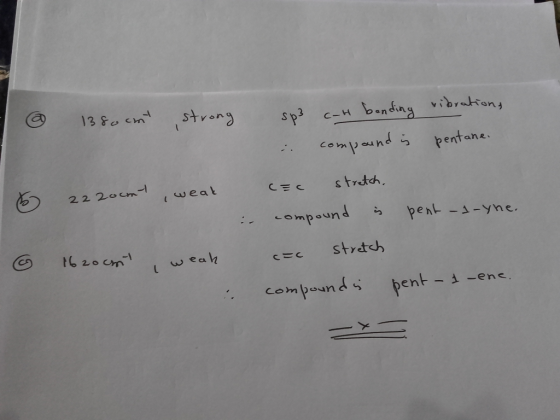
3. Based on the peaks below, identify each compound as pentane, pent-1-ene and pent-1-yne and list...
which of the above 8 terpenes does the IR spectrum belongs to ? determine the peaks...
 which of the above 8 terpenes does the IR spectrum
belongs to ?
determine the peaks that belongs to the terpene.
attached are reference table for finding peaks .
U right scandidate terpenes narrone Citral litronellol p-upmene Myreene geraniol linenene Menthone Transance 4000 101 - Wed Oct 15 703 322019 GMT-0001 3500 3000 2964.0B 304704 3D08.40 2919.65 205448 2500 2000 1715.80 1645.25 1622 07 159331 1576 51 1495 54 1449.04 1376.494 133870 126369 115592 109716 980 65 955.96 914 BBB...
which of the above 8 terpenes does the IR spectrum
belongs to ?
determine the peaks that belongs to the terpene.
attached are reference table for finding peaks .
U right scandidate terpenes narrone Citral litronellol p-upmene Myreene geraniol linenene Menthone Transance 4000 101 - Wed Oct 15 703 322019 GMT-0001 3500 3000 2964.0B 304704 3D08.40 2919.65 205448 2500 2000 1715.80 1645.25 1622 07 159331 1576 51 1495 54 1449.04 1376.494 133870 126369 115592 109716 980 65 955.96 914 BBB...
3) Show how hex-1-yne might be converted to: a. 1-bromohex-1-ene b. 1,1,2,2-tetrabromohexane C. 2-bromohex-1-ene d. 2-bromohexane...
 3) Show how hex-1-yne might be converted to: a. 1-bromohex-1-ene b. 1,1,2,2-tetrabromohexane C. 2-bromohex-1-ene d. 2-bromohexane e. 2,2-dibromohexane 4) For each compound, give the product(s) expected from (1) HgSo./H2SO4-catalyzed hydration and (2) hydroboration-oxidation. a. hex-1-yne b. hex-2-yne c. hex-3-yne d. cyclodecyne 5) Predict the product(s) you would expect from treatment of each compound with (1) dilute, neutral KMnO, and (2) warm, basic KMnO, then dilute acid. a. hex-1-yne b. hex-2-yne c. hex-3-yne d. 2-methylhex-3-yne e. But-1-ene → butan-2-ol 6) Show...
please help me identify each numbered peak beyond 1500 cm-1. For each peak above 3000 cm-1...
 please help me identify each numbered peak beyond 1500 cm-1.
For each peak above 3000 cm-1 please identify them as sp1, sp2 or
sp3.
* * 3 * B&BRE 400 000 000 200 00 00 Pure Ethanol 2023.83 DOKOMOKO OZ REKON O em G 00 200 000 6 Unknown A853 0 0 1438.63 WhO Unknown 200 KED B297 RO 107.17 FON: 2000 2000 2000 2100 2200 2000 1200 900 900 WOO 200 000 ethanol Intensity of Signal How to The...
please help me identify each numbered peak beyond 1500 cm-1.
For each peak above 3000 cm-1 please identify them as sp1, sp2 or
sp3.
* * 3 * B&BRE 400 000 000 200 00 00 Pure Ethanol 2023.83 DOKOMOKO OZ REKON O em G 00 200 000 6 Unknown A853 0 0 1438.63 WhO Unknown 200 KED B297 RO 107.17 FON: 2000 2000 2000 2100 2200 2000 1200 900 900 WOO 200 000 ethanol Intensity of Signal How to The...
need help figuring the unknown and starting these questions. Identify the important (diagnostic) peaks from the...
 need help figuring the unknown and starting these
questions.
Identify the important (diagnostic) peaks from the IR spectrum. corresponds to each peak below. Be sure to also add labels your IR spectrum (write the corresponding bond type next to each peak on the IR spectrum itself) 2. List the cm 1 and the bond that 3. List all possible classes of compounds that your unknown could be (i.e. could the unknown be a ketone, alcohol, ester, carboxylic acid? does the...
need help figuring the unknown and starting these
questions.
Identify the important (diagnostic) peaks from the IR spectrum. corresponds to each peak below. Be sure to also add labels your IR spectrum (write the corresponding bond type next to each peak on the IR spectrum itself) 2. List the cm 1 and the bond that 3. List all possible classes of compounds that your unknown could be (i.e. could the unknown be a ketone, alcohol, ester, carboxylic acid? does the...
3. the followong compound has a molecular formula of C6H10O2 and has two stronf syretching bibration peaks in its FTIR spectrum at 1725 and 1200cm-1 giving rise to a specific functional group. what i...
 3. the followong compound has a molecular formula of C6H10O2
and has two stronf syretching bibration peaks in its FTIR spectrum
at 1725 and 1200cm-1 giving rise to a specific functional group.
what is this molecule.
4. based on the mass spectrum below-which heteratom (S, Br,
Cl) is present in the molecule that produces this spectrum?
5. which functional group is present in the molecule that
produces the followong IR spectra?
please answer questions 3-5
Verizon 7:24 PM 3 of...
3. the followong compound has a molecular formula of C6H10O2
and has two stronf syretching bibration peaks in its FTIR spectrum
at 1725 and 1200cm-1 giving rise to a specific functional group.
what is this molecule.
4. based on the mass spectrum below-which heteratom (S, Br,
Cl) is present in the molecule that produces this spectrum?
5. which functional group is present in the molecule that
produces the followong IR spectra?
please answer questions 3-5
Verizon 7:24 PM 3 of...
Chem 210 Report - IR Spectroscopy Name: ID: 1) For the functional group(s) on the following...
Chem 210 Report - IR Spectroscopy Name: ID: 1) For the functional group(s) on the following molecule what characteristic IR absorption(s) would be expected (ignoring C-H absorptions). A) a peak around 1700 cm–1 B) a peak around 3300 cm–1 C) a peak around 1650 cm–1 D) a peak around 2250 cm–1 E) None of these choices Answer: 2) An oxygen-containing compound shows strong IR absorption at 1630-1780 cm–1 and 3200-3550 –1 cm . What type of compound is it likely...
1. How many peaks would be observed in the 'H NMR spectrum of each compound below?...
 1. How many peaks would be observed in the 'H NMR spectrum of each compound below? 2. How many peaks would be observed in the 1"C NMR spectrum of each compound below'?
8. The nass spectrum of which compound has M and N+2 peaks of approxinately equal intensity?...
 8. The nass spectrum of which compound has M and N+2 peaks of approxinately equal intensity? A) 3-bromopentane B) 3-pentanol C) pentane D) 3-chloropentane E) 3-iodopentane 9. Consider the structure isomers. 1-bromopropane (A) and 2-bromopropane (B) respectively. How many unique proton peaks are in es H NMR? A) A: 4 types, B: 4 types B) A: 3 types, B: 2 types C) A: 2 types, B: 3 types D) A: 8 types, B: 8 types E A: 4 types, B:...
Procedure-Part 1: Obtain an infrared spectrum for one of the following known organic liquids: oleic acid...
 Procedure-Part 1: Obtain an infrared spectrum for one of the following known organic liquids: oleic acid (K1), butyl methyl ether (K2), or cyclo hexanone (K3). Place-20 pL of HO sample on the diamond crystal. Analyze your spectrum K1 and complete the table below. List five to ten of the most important/prominent peaks in the spectrum; round wavenumber values to the nearest whole number. Note the intensity/shape of each peak using the following descriptors: strong, medium, weak, and broad. Identify if...
Information: Each spectra below was obtained from a pure compound Mass Spectrum parent peaks (M) are listed for all ex...
 Information: Each spectra below was obtained from a pure compound Mass Spectrum parent peaks (M) are listed for all examples. IR peaks listed are strong (s) unless otherwise indicated for signals above 1500 cm *H NMR Spectra, the integral is given in number of hydrogens (#H) or as a relative ratio. Important coupling constants (-values) are listed next to the peaks for some examples. For some spectra, an inset (grey box) is also given showing a "zoom-in" on an important...
 which of the above 8 terpenes does the IR spectrum
belongs to ?
determine the peaks that belongs to the terpene.
attached are reference table for finding peaks .
U right scandidate terpenes narrone Citral litronellol p-upmene Myreene geraniol linenene Menthone Transance 4000 101 - Wed Oct 15 703 322019 GMT-0001 3500 3000 2964.0B 304704 3D08.40 2919.65 205448 2500 2000 1715.80 1645.25 1622 07 159331 1576 51 1495 54 1449.04 1376.494 133870 126369 115592 109716 980 65 955.96 914 BBB...
which of the above 8 terpenes does the IR spectrum
belongs to ?
determine the peaks that belongs to the terpene.
attached are reference table for finding peaks .
U right scandidate terpenes narrone Citral litronellol p-upmene Myreene geraniol linenene Menthone Transance 4000 101 - Wed Oct 15 703 322019 GMT-0001 3500 3000 2964.0B 304704 3D08.40 2919.65 205448 2500 2000 1715.80 1645.25 1622 07 159331 1576 51 1495 54 1449.04 1376.494 133870 126369 115592 109716 980 65 955.96 914 BBB...
 3) Show how hex-1-yne might be converted to: a. 1-bromohex-1-ene b. 1,1,2,2-tetrabromohexane C. 2-bromohex-1-ene d. 2-bromohexane e. 2,2-dibromohexane 4) For each compound, give the product(s) expected from (1) HgSo./H2SO4-catalyzed hydration and (2) hydroboration-oxidation. a. hex-1-yne b. hex-2-yne c. hex-3-yne d. cyclodecyne 5) Predict the product(s) you would expect from treatment of each compound with (1) dilute, neutral KMnO, and (2) warm, basic KMnO, then dilute acid. a. hex-1-yne b. hex-2-yne c. hex-3-yne d. 2-methylhex-3-yne e. But-1-ene → butan-2-ol 6) Show...
 please help me identify each numbered peak beyond 1500 cm-1.
For each peak above 3000 cm-1 please identify them as sp1, sp2 or
sp3.
* * 3 * B&BRE 400 000 000 200 00 00 Pure Ethanol 2023.83 DOKOMOKO OZ REKON O em G 00 200 000 6 Unknown A853 0 0 1438.63 WhO Unknown 200 KED B297 RO 107.17 FON: 2000 2000 2000 2100 2200 2000 1200 900 900 WOO 200 000 ethanol Intensity of Signal How to The...
please help me identify each numbered peak beyond 1500 cm-1.
For each peak above 3000 cm-1 please identify them as sp1, sp2 or
sp3.
* * 3 * B&BRE 400 000 000 200 00 00 Pure Ethanol 2023.83 DOKOMOKO OZ REKON O em G 00 200 000 6 Unknown A853 0 0 1438.63 WhO Unknown 200 KED B297 RO 107.17 FON: 2000 2000 2000 2100 2200 2000 1200 900 900 WOO 200 000 ethanol Intensity of Signal How to The...
 need help figuring the unknown and starting these
questions.
Identify the important (diagnostic) peaks from the IR spectrum. corresponds to each peak below. Be sure to also add labels your IR spectrum (write the corresponding bond type next to each peak on the IR spectrum itself) 2. List the cm 1 and the bond that 3. List all possible classes of compounds that your unknown could be (i.e. could the unknown be a ketone, alcohol, ester, carboxylic acid? does the...
need help figuring the unknown and starting these
questions.
Identify the important (diagnostic) peaks from the IR spectrum. corresponds to each peak below. Be sure to also add labels your IR spectrum (write the corresponding bond type next to each peak on the IR spectrum itself) 2. List the cm 1 and the bond that 3. List all possible classes of compounds that your unknown could be (i.e. could the unknown be a ketone, alcohol, ester, carboxylic acid? does the...
 3. the followong compound has a molecular formula of C6H10O2
and has two stronf syretching bibration peaks in its FTIR spectrum
at 1725 and 1200cm-1 giving rise to a specific functional group.
what is this molecule.
4. based on the mass spectrum below-which heteratom (S, Br,
Cl) is present in the molecule that produces this spectrum?
5. which functional group is present in the molecule that
produces the followong IR spectra?
please answer questions 3-5
Verizon 7:24 PM 3 of...
3. the followong compound has a molecular formula of C6H10O2
and has two stronf syretching bibration peaks in its FTIR spectrum
at 1725 and 1200cm-1 giving rise to a specific functional group.
what is this molecule.
4. based on the mass spectrum below-which heteratom (S, Br,
Cl) is present in the molecule that produces this spectrum?
5. which functional group is present in the molecule that
produces the followong IR spectra?
please answer questions 3-5
Verizon 7:24 PM 3 of...
 1. How many peaks would be observed in the 'H NMR spectrum of each compound below? 2. How many peaks would be observed in the 1"C NMR spectrum of each compound below'?
 8. The nass spectrum of which compound has M and N+2 peaks of approxinately equal intensity? A) 3-bromopentane B) 3-pentanol C) pentane D) 3-chloropentane E) 3-iodopentane 9. Consider the structure isomers. 1-bromopropane (A) and 2-bromopropane (B) respectively. How many unique proton peaks are in es H NMR? A) A: 4 types, B: 4 types B) A: 3 types, B: 2 types C) A: 2 types, B: 3 types D) A: 8 types, B: 8 types E A: 4 types, B:...
 Procedure-Part 1: Obtain an infrared spectrum for one of the following known organic liquids: oleic acid (K1), butyl methyl ether (K2), or cyclo hexanone (K3). Place-20 pL of HO sample on the diamond crystal. Analyze your spectrum K1 and complete the table below. List five to ten of the most important/prominent peaks in the spectrum; round wavenumber values to the nearest whole number. Note the intensity/shape of each peak using the following descriptors: strong, medium, weak, and broad. Identify if...
 Information: Each spectra below was obtained from a pure compound Mass Spectrum parent peaks (M) are listed for all examples. IR peaks listed are strong (s) unless otherwise indicated for signals above 1500 cm *H NMR Spectra, the integral is given in number of hydrogens (#H) or as a relative ratio. Important coupling constants (-values) are listed next to the peaks for some examples. For some spectra, an inset (grey box) is also given showing a "zoom-in" on an important...
Most questions answered within 3 hours.
-
A hospital performs 100 surgeries per week. The probability that
complications after surgery occur is 10%....
asked 48 seconds from now -
A 5.20 mW helium neon laser emits a visible laser beam with a
wavelength of 633...
asked 14 seconds from now -
In preparing its cash flow statement for the year ended December
31, 2018, Green Co. gathered...
asked 53 seconds ago -
Donna is 18 years old and full time accounting student.She is
saving for an overseas holiday...
asked 1 minute ago -
Service-oriented architectures (SOA) provide
object-oriented architectures for web platforms that represent a
collection of services. SOA...
asked 1 minute ago -
Le Terroir Winery is considering an expansion project to produce
fine wines. The trial expansion will...
asked 10 minutes ago -
The Bahraini public budget experiences deficit in the last
seven years, what are procedures are taken...
asked 17 minutes ago -
You invested $30,000 in a mutual fund at the beginning of the
year when the NAV...
asked 21 minutes ago -
Would you expect the price elasticity of supply for guitars to
be more inelastic in the...
asked 23 minutes ago -
A snowmobile is originally at the point with position vector
30.1 m at 95.0° counterclockwise from...
asked 23 minutes ago -
MAN3240 Organizational Behavior
In one to two paragraphs
6.) How can understanding emotions make me more...
asked 31 minutes ago -
Identify one individual who, in your opinion, is an excellent
leader. List the qualities that this...
asked 28 minutes ago