1. Describe, in your own words, the Laspeyres Index, the Paasche Index, and the Fisher Index (chain-weighting).
2. Consider a country that only produces cars, cantaloupes, and
catamarans. Complete the following table by filling in the missing
entries.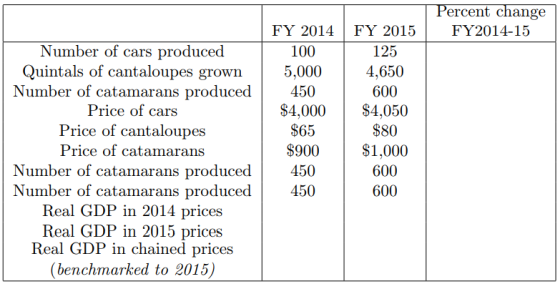
3. Calculate the inflation rate for the 2014-15 period using the GDP deflator based on the Laspeyres Index, the Paasche Index, and the Fisher (chain-weighted) Index.
Homework Answers

Table 1
| Quantity | Price | Percentage Change | ||||
| Items | 2014 | 2015 | 2014 | 2015 | Price | Quantity |
| Car | 100 | 125 | 4000 | 4050 | 25.0% | 1.3% |
| Cantaloup | 5000 | 4650 | 65 | 80 | -7.0% | 23.1% |
| catamaran | 450 | 600 | 900 | 1000 | 33.3% | 11.1% |
| Real GDP in 2014 prices | 1130000 | 1255000 | ||||
| Real GDP in 2015 prices | 1342250 | 1478250 | ||||
| Real GDP in chained prices (benchmark=2015) | 1249736.12 | 1478250 | ||||
3.
The three indexes using the formula above is calculated below
| 2014 | 2015 | |
| L Index | 100 | 101.25 |
| P Index | 100 | 117.79 |
| F Index | 100 | 109.21 |
Inflation using GDP deflator between 2014 and 2015 is calculated as the percentage change in CPI. As 2014 is the base year assumed, the inflation is only the difference between two-year indexes.
| 2014 | 2015 | Inflation | |
| L Index | 100 | 101.25 | 1.3 |
| P Index | 100 | 117.79 | 17.8 |
| F Index | 100 | 109.21 | 9.2 |
Add Answer to:
1. Describe, in your own words, the Laspeyres Index, the Paasche
Index, and the Fisher Index...
Inflation in the orange and boomerang economy: calculate the inflation rate for the 2020- 2021 period...
 Inflation in the orange and boomerang economy: calculate the
inflation rate for the 2020- 2021 period using the GDP deflactor
based on the laspeyers, passche and chain- weighted indexes of
GDP
5. National accounting over time (W): Consider an economy that produces or and boomerangs. The prices and quantities of these goods in two dif years are reported in the table below. Fill in the missing entries. Percentage change 2020 2020-2021 100 20 2021 105 22 .10 3.10 1 1...
Inflation in the orange and boomerang economy: calculate the
inflation rate for the 2020- 2021 period using the GDP deflactor
based on the laspeyers, passche and chain- weighted indexes of
GDP
5. National accounting over time (W): Consider an economy that produces or and boomerangs. The prices and quantities of these goods in two dif years are reported in the table below. Fill in the missing entries. Percentage change 2020 2020-2021 100 20 2021 105 22 .10 3.10 1 1...
Consider an economy that produces and consumes hot dogs and hamburgers
 LounchPod • Consider an economy that produces and consumes hot dogs and hamburgers. In the following table are data for two different years. a. Using 2010 as the base year, compute the following statistics for each year: nominal GDP, real GDP, the implicit price deflator for GDP, and a fixed-weight price index such as the CPI. b. By what percentage did prices rise between 2010 and 2015? Give the answer for each good and also for the two measures of the overall...
7. LounchPad . Consider an economy that produces and consumes hot dogs and ham- burgers. In...
 7. LounchPad . Consider an economy that produces and consumes hot dogs and ham- burgers. In the following table are data for two different years 2013 2015 Good Hot dogs Hamburgers Quantity Quantity Price 250 $4 500 $4 200 $$2 200 $3 a. Using 2010 as the base year, compute the following statistics for each year: nominal GDP, real GDP, the implicit price deflator for GDP, and a fixed-weight price index such as the CPI. b. By what percentage did...
DO #1 Real GDP is intended to measure the real value of goods and services produced,...
 DO #1
Real GDP is intended to measure the real value of goods and
services produced, not the stock of money, or the balance in your
bank account, or whether you are in debt or not. To do this, we may
use information on total expenditures - measured in dollars - but
the purpose is always to recover an index of real output. For this
homework, you need the following information to calculate real GDP
over several periods. First, you...
DO #1
Real GDP is intended to measure the real value of goods and
services produced, not the stock of money, or the balance in your
bank account, or whether you are in debt or not. To do this, we may
use information on total expenditures - measured in dollars - but
the purpose is always to recover an index of real output. For this
homework, you need the following information to calculate real GDP
over several periods. First, you...
DO#3 Real GDP is intended to measure the real value of goods and services produced, not...
 DO#3
Real GDP is intended to measure the real value of goods and
services produced, not the stock of money, or the balance in your
bank account, or whether you are in debt or not. To do this, we may
use information on total expenditures - measured in dollars - but
the purpose is always to recover an index of real output. For this
homework, you need the following information to calculate real GDP
over several periods. First, you know...
DO#3
Real GDP is intended to measure the real value of goods and
services produced, not the stock of money, or the balance in your
bank account, or whether you are in debt or not. To do this, we may
use information on total expenditures - measured in dollars - but
the purpose is always to recover an index of real output. For this
homework, you need the following information to calculate real GDP
over several periods. First, you know...
DO #2 Real GDP is intended to measure the real value of goods and services produced,...
 DO #2
Real GDP is intended to measure the real value of goods and
services produced, not the stock of money, or the balance in your
bank account, or whether you are in debt or not. To do this, we may
use information on total expenditures - measured in dollars - but
the purpose is always to recover an index of real output. For this
homework, you need the following information to calculate real GDP
over several periods. First, you...
DO #2
Real GDP is intended to measure the real value of goods and
services produced, not the stock of money, or the balance in your
bank account, or whether you are in debt or not. To do this, we may
use information on total expenditures - measured in dollars - but
the purpose is always to recover an index of real output. For this
homework, you need the following information to calculate real GDP
over several periods. First, you...
Question B.1: National Accounts [28 points] Consider a world that consists of only two countries,...
 Question B.1: National Accounts [28 points] Consider a world that consists of only two countries, A and B, that trade with each other The countries use a common currency, so nominal variables are comparable across countries. The total production of these countries is summarized in the following tables Country A Apples Country B Apples Oranges Peaches year year uant ice quant rice uant ice quant ice 2014 1.000 $0.90500$2.00 2015 1.200 $1.00550$2.00 2014 2,000 $0.90500 $3.00 2015 1,900 $1.00 600...
Instructions: Enter your responses rounded to the nearest billion. a. Calculate real GDP for 2016 using...
 Instructions: Enter your
responses rounded to the nearest billion.
a. Calculate real GDP for 2016 using 2000 prices.
$ billion
b. By how much did real GDP increase between 2000 and 2016?
$ billion
c. By how much did nominal GDP increase between 2000 and
2016?
$ billion
Refer to the data below (all values are in billions): Year Nominal GDP GDP Deflator (in Billions of Dollars) (Price Index 2009 100) 2000 2001 2002 2003 2004 2005 2006 2007 2008 2009...
Instructions: Enter your
responses rounded to the nearest billion.
a. Calculate real GDP for 2016 using 2000 prices.
$ billion
b. By how much did real GDP increase between 2000 and 2016?
$ billion
c. By how much did nominal GDP increase between 2000 and
2016?
$ billion
Refer to the data below (all values are in billions): Year Nominal GDP GDP Deflator (in Billions of Dollars) (Price Index 2009 100) 2000 2001 2002 2003 2004 2005 2006 2007 2008 2009...
Assume that an economy produces only three goods; Computers, cars, and pizza. Table 1 gives the price and quantity for each good and the number of employed and unemployed individuals for the years 2010-2013. Table 2 gives the fixed basket used for calcula
 Assume that an economy produces
only three goods; Computers, cars, and pizza. Table 1 gives the price
and quantity for each good and the number of employed and unemployed
individuals for the years 2010-2013. Table 2 gives the fixed basket used
for calculating the CPI. Assume that the base year is 2011 and show
your work! Table 1 - Price and Quantity of Goods Sold in 2010-2013 2010
2011 2012 2013 P Q P O P Q 25 Computers Cars...
Assume that an economy produces
only three goods; Computers, cars, and pizza. Table 1 gives the price
and quantity for each good and the number of employed and unemployed
individuals for the years 2010-2013. Table 2 gives the fixed basket used
for calculating the CPI. Assume that the base year is 2011 and show
your work! Table 1 - Price and Quantity of Goods Sold in 2010-2013 2010
2011 2012 2013 P Q P O P Q 25 Computers Cars...
Year 2000 GDP Deflator (Price Index, 2009 = 100) 81.9 83.8 85.0 2001 2002 2003 2004...
 Year 2000 GDP Deflator (Price Index, 2009 = 100) 81.9 83.8 85.0 2001 2002 2003 2004 2005 & 2007 Nominal GDP (in Billions of Dollars) 9,817 10.128 10.469 10,960 11,685 12,422 13,178 13,808 14,291 13,939 14,524 15,518 16,163 16,768 17,393 18,037 18,569 2008 2009 2010 2011 2012 2013 2014 2015 2016 100.0 101.2 103.3 105.2 106.7 108.8 110.0 111.4 Instructions: Enter your responses rounded to the nearest billion. a. Calculate real GDP for 2015 using 2007 prices. $0 billion b....
 Inflation in the orange and boomerang economy: calculate the
inflation rate for the 2020- 2021 period using the GDP deflactor
based on the laspeyers, passche and chain- weighted indexes of
GDP
5. National accounting over time (W): Consider an economy that produces or and boomerangs. The prices and quantities of these goods in two dif years are reported in the table below. Fill in the missing entries. Percentage change 2020 2020-2021 100 20 2021 105 22 .10 3.10 1 1...
Inflation in the orange and boomerang economy: calculate the
inflation rate for the 2020- 2021 period using the GDP deflactor
based on the laspeyers, passche and chain- weighted indexes of
GDP
5. National accounting over time (W): Consider an economy that produces or and boomerangs. The prices and quantities of these goods in two dif years are reported in the table below. Fill in the missing entries. Percentage change 2020 2020-2021 100 20 2021 105 22 .10 3.10 1 1...
 7. LounchPad . Consider an economy that produces and consumes hot dogs and ham- burgers. In the following table are data for two different years 2013 2015 Good Hot dogs Hamburgers Quantity Quantity Price 250 $4 500 $4 200 $$2 200 $3 a. Using 2010 as the base year, compute the following statistics for each year: nominal GDP, real GDP, the implicit price deflator for GDP, and a fixed-weight price index such as the CPI. b. By what percentage did...
 DO #1
Real GDP is intended to measure the real value of goods and
services produced, not the stock of money, or the balance in your
bank account, or whether you are in debt or not. To do this, we may
use information on total expenditures - measured in dollars - but
the purpose is always to recover an index of real output. For this
homework, you need the following information to calculate real GDP
over several periods. First, you...
DO #1
Real GDP is intended to measure the real value of goods and
services produced, not the stock of money, or the balance in your
bank account, or whether you are in debt or not. To do this, we may
use information on total expenditures - measured in dollars - but
the purpose is always to recover an index of real output. For this
homework, you need the following information to calculate real GDP
over several periods. First, you...
 DO#3
Real GDP is intended to measure the real value of goods and
services produced, not the stock of money, or the balance in your
bank account, or whether you are in debt or not. To do this, we may
use information on total expenditures - measured in dollars - but
the purpose is always to recover an index of real output. For this
homework, you need the following information to calculate real GDP
over several periods. First, you know...
DO#3
Real GDP is intended to measure the real value of goods and
services produced, not the stock of money, or the balance in your
bank account, or whether you are in debt or not. To do this, we may
use information on total expenditures - measured in dollars - but
the purpose is always to recover an index of real output. For this
homework, you need the following information to calculate real GDP
over several periods. First, you know...
 DO #2
Real GDP is intended to measure the real value of goods and
services produced, not the stock of money, or the balance in your
bank account, or whether you are in debt or not. To do this, we may
use information on total expenditures - measured in dollars - but
the purpose is always to recover an index of real output. For this
homework, you need the following information to calculate real GDP
over several periods. First, you...
DO #2
Real GDP is intended to measure the real value of goods and
services produced, not the stock of money, or the balance in your
bank account, or whether you are in debt or not. To do this, we may
use information on total expenditures - measured in dollars - but
the purpose is always to recover an index of real output. For this
homework, you need the following information to calculate real GDP
over several periods. First, you...
 Question B.1: National Accounts [28 points] Consider a world that consists of only two countries, A and B, that trade with each other The countries use a common currency, so nominal variables are comparable across countries. The total production of these countries is summarized in the following tables Country A Apples Country B Apples Oranges Peaches year year uant ice quant rice uant ice quant ice 2014 1.000 $0.90500$2.00 2015 1.200 $1.00550$2.00 2014 2,000 $0.90500 $3.00 2015 1,900 $1.00 600...
 Instructions: Enter your
responses rounded to the nearest billion.
a. Calculate real GDP for 2016 using 2000 prices.
$ billion
b. By how much did real GDP increase between 2000 and 2016?
$ billion
c. By how much did nominal GDP increase between 2000 and
2016?
$ billion
Refer to the data below (all values are in billions): Year Nominal GDP GDP Deflator (in Billions of Dollars) (Price Index 2009 100) 2000 2001 2002 2003 2004 2005 2006 2007 2008 2009...
Instructions: Enter your
responses rounded to the nearest billion.
a. Calculate real GDP for 2016 using 2000 prices.
$ billion
b. By how much did real GDP increase between 2000 and 2016?
$ billion
c. By how much did nominal GDP increase between 2000 and
2016?
$ billion
Refer to the data below (all values are in billions): Year Nominal GDP GDP Deflator (in Billions of Dollars) (Price Index 2009 100) 2000 2001 2002 2003 2004 2005 2006 2007 2008 2009...
 Year 2000 GDP Deflator (Price Index, 2009 = 100) 81.9 83.8 85.0 2001 2002 2003 2004 2005 & 2007 Nominal GDP (in Billions of Dollars) 9,817 10.128 10.469 10,960 11,685 12,422 13,178 13,808 14,291 13,939 14,524 15,518 16,163 16,768 17,393 18,037 18,569 2008 2009 2010 2011 2012 2013 2014 2015 2016 100.0 101.2 103.3 105.2 106.7 108.8 110.0 111.4 Instructions: Enter your responses rounded to the nearest billion. a. Calculate real GDP for 2015 using 2007 prices. $0 billion b....
Most questions answered within 3 hours.
-
Break-even time. Hampton Corporation’s research
and development department is presenting a proposal for new product
research....
asked 1 minute ago -
At Lake Itasca in Minnesota, the Mississippi river is only 25.0
feet wide. If you are...
asked 2 minutes ago -
A 2.0 μF parallel-plate air-filled capacitor is connected
across a 10 V battery.
(a) Determine the...
asked 12 minutes ago -
Write in Python This program:
1. Correct the compute_cells_state function which receives as
parameter an array...
asked 2 minutes ago -
1. What is the difference in the output layer between a neural
network used for classification,...
asked 10 minutes ago -
ECO
2013 &
asked 17 minutes ago -
Insight refers to:
a.
Adaptive decision-making
b.
Credibility and trustworthness
c.
Understanding of one's problems
d....
asked 23 minutes ago -
Explain the differences between rights and permissions within
Windows. Define the principle of least privilege and...
asked 30 minutes ago -
A solid, frictionless cylindrical reel of mass M=5.00kg and
radius R=0.55m is used to draw water...
asked 33 minutes ago -
how do radio waves get emitted from Jupiter?
- do they come from radiation from planet...
asked 33 minutes ago -
The test statistic used in the F test for the equality of two
variances is calculated...
asked 45 minutes ago -
How does neutralisation of IL-6 trans-signaling affect the
autoimmune disease and inflammation? What if the trans-signaling...
asked 35 minutes ago