DO #2
Real GDP is intended to measure the real value of goods and services produced, not the stock of money, or the balance in your bank account, or whether you are in debt or not. To do this, we may use information on total expenditures - measured in dollars - but the purpose is always to recover an index of real output. For this homework, you need the following information to calculate real GDP over several periods. First, you know total expenditures (dollars spent) on three different kinds of goods
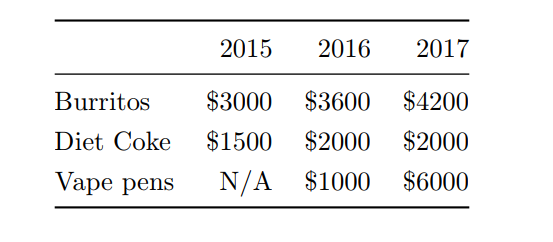
where the “N/A” for vape pens is because no one collected data on this in 2015 because they were still pretty new. You also have price data that was collected on several items.

Given that information, you need to calculate an index of real GDP for the economy. To start, just focus on the 2016 and 2017 numbers.
1. Use the price information and expenditure information to calculate the implied quantity of each good purchased in 2016 and 2017. For example, there were 700 burritos purchased in 2017 ($4200 divided by $6)
2. Calculate implied expenditures using common prices • Calculate total expenditure on all goods in 2017 using 2016 prices. For example, Diet Coke expenditure in 2017 using 2016 prices would be 1000 (2017 quantity) times $1 (2016 price) equals $1000.
• Divide 2017 expenditure using 2016 prices (from the prior point) by the 2016 expenditure using 2016 prices (which is just total reported expenditure from 2016, $6600). This is one index of how much real GDP changed from 2016 to 2017. Did it go up or down?
• Now, calculate total expenditure on all goods in 2016 using 2017 prices.
• Divide 2017 expenditure using 2017 prices (which is just total reported 2017 expenditure, $12200) by the 2016 expenditure at 2017 prices (from the prior point). This is another index of how much real GDP changed from 2016 to 2017. Did it go up or down?
• Neither of the two indices that you got for real GDP is exactly right, as there is no right answer to which year’s prices you should use. So we typically use a geometric average. Take the two indices of real GDP and multiply them together. Then take the square root of this product. That is your combined index of how much real GDP changed from 2016 to 2017. Did it go up or down?
3.The prior point makes clear that we want to value output in each year at the same set of prices. A different way to do this is to separately calculate how much prices went up from 2016 to 2017, and then use that to deflate total expenditures.
• Calculate the Laspeyres price index for 2017. First, calculate total 2016 expenditure using 2017 prices (e.g. 2000 Diet Cokes times $2 equals $4000) for all three goods. Second, get 2016 expenditure using 2016 prices (just add up total expenditure for 2016). Last, divide the first by the second. This is the Laspeyres price index. Does it say prices were higher or lower in 2017 than in 2016?
• Calculate the Paasche price index for 2017. First, calculate 2017 expenditure using 2017 prices. Second, calculate 2017 expenditure using 2016 prices. Last, divide the first by the second. This is the Paasche price index. Does it say prices were higher or lower in 2017 than in 2016?
• Again, neither of these two price indices is exactly right, because there is no reason that using either the 2017 quantities (Paasche) or 2016 quantities (Laspeyres) is better than the other. So take the two prices indices, multiply them together, and then take the square root. This is the Fisher price index for 2017. Does it say prices were higher or lower?
• Finally, we can use the Fisher price index to calculate an index of real GDP. For 2016 (our base year), real GDP is just equal to 1. For 2017, real GDP is total 2017 expenditure divided by the Fisher price index - this is what we mean to deflate 2017 expenditure. What is the index of real GDP for 2017? How does it compare to what you calculated above?
4.. Okay, now go back and redo the calculations of real GDP, but this time comparing 2015 to 2016. You’ll notice that you do not have any information on vape pens from 2015, either in expenditure or price. You’ll have to come up with some way of including vape pens in your calculation, because they do show up in 2016. That means you need some way of comparing the quantity and/or price of vape pens between 2015 and 2016. There is no right answer. There are multiple things one could do, but you should justify in writing why you chose what you chose.
Homework Answers

Add Answer to:
DO #2
Real GDP is intended to measure the real value of goods and
services produced,...
DO #1 Real GDP is intended to measure the real value of goods and services produced,...
 DO #1
Real GDP is intended to measure the real value of goods and
services produced, not the stock of money, or the balance in your
bank account, or whether you are in debt or not. To do this, we may
use information on total expenditures - measured in dollars - but
the purpose is always to recover an index of real output. For this
homework, you need the following information to calculate real GDP
over several periods. First, you...
DO #1
Real GDP is intended to measure the real value of goods and
services produced, not the stock of money, or the balance in your
bank account, or whether you are in debt or not. To do this, we may
use information on total expenditures - measured in dollars - but
the purpose is always to recover an index of real output. For this
homework, you need the following information to calculate real GDP
over several periods. First, you...
DO#3 Real GDP is intended to measure the real value of goods and services produced, not...
 DO#3
Real GDP is intended to measure the real value of goods and
services produced, not the stock of money, or the balance in your
bank account, or whether you are in debt or not. To do this, we may
use information on total expenditures - measured in dollars - but
the purpose is always to recover an index of real output. For this
homework, you need the following information to calculate real GDP
over several periods. First, you know...
DO#3
Real GDP is intended to measure the real value of goods and
services produced, not the stock of money, or the balance in your
bank account, or whether you are in debt or not. To do this, we may
use information on total expenditures - measured in dollars - but
the purpose is always to recover an index of real output. For this
homework, you need the following information to calculate real GDP
over several periods. First, you know...
DO #4 Real GDP is intended to measure the real value of goods and services produced,...
 DO #4
Real GDP is intended to measure the real value of goods and
services produced, not the stock of money, or the balance in your
bank account, or whether you are in debt or not. To do this, we may
use information on total expenditures - measured in dollars - but
the purpose is always to recover an index of real output. For this
homework, you need the following information to calculate real GDP
over several periods. First, you...
DO #4
Real GDP is intended to measure the real value of goods and
services produced, not the stock of money, or the balance in your
bank account, or whether you are in debt or not. To do this, we may
use information on total expenditures - measured in dollars - but
the purpose is always to recover an index of real output. For this
homework, you need the following information to calculate real GDP
over several periods. First, you...
1. Describe, in your own words, the Laspeyres Index, the Paasche Index, and the Fisher Index...
 1. Describe, in your own words, the Laspeyres Index, the Paasche
Index, and the Fisher Index (chain-weighting).
2. Consider a country that only produces cars, cantaloupes, and
catamarans. Complete the following table by filling in the missing
entries.
3. Calculate the inflation rate for the 2014-15 period using the
GDP deflator based on the Laspeyres Index, the Paasche Index, and
the Fisher (chain-weighted) Index.
ercent change FY2014-15 FY 2014 FY 2015 Number of cars produced 100 125 Quintals of cantaloupes...
1. Describe, in your own words, the Laspeyres Index, the Paasche
Index, and the Fisher Index (chain-weighting).
2. Consider a country that only produces cars, cantaloupes, and
catamarans. Complete the following table by filling in the missing
entries.
3. Calculate the inflation rate for the 2014-15 period using the
GDP deflator based on the Laspeyres Index, the Paasche Index, and
the Fisher (chain-weighted) Index.
ercent change FY2014-15 FY 2014 FY 2015 Number of cars produced 100 125 Quintals of cantaloupes...
5. Real versus nominal GDP Consider a simple economy that produces two goods: pens and envelopes....
 5. Real versus nominal GDP Consider a simple economy that produces two goods: pens and envelopes. The following table shows the prices and quantities of the goods over a three-year period Pens Price Quantity (Dollars per pen) (Number of pens) 1 110 Envelopes Price Quantity (Dollars per envelope) (Number of envelopes) 180 Year 2015 4 2015 140 210 2 2017 4 100 190 4 Use the information from the preceding table to fill in the following table. Nominal GDP (Dollars)...
5. The economy of Britannica produces three Year Computers DVDs Pizzas goods: computers, DVDs, and pizza....
 5. The economy of Britannica produces three Year Computers DVDs Pizzas goods: computers, DVDs, and pizza. The Price Quantity Price Quantity Price Quantity accompanying table shows the prices and 2010 $900 10 $10 100 15 2 output of the three goods for the years 2011 1,000 10.5 12 105 16 2 2012 1,050 12 14 110 2010, 2011, and 2012. a. Calculate nominal GDP in Britannica for each of the three years. What is the per- cent change in nominal...
2. Consider a hypothetical economy which produces three goods: TVs, books, and hamburgers. The following table...
 2. Consider a hypothetical economy which produces three goods: TVs, books, and hamburgers. The following table shows the prices and output of the three goods for the years 2015, 2016, and 2017. Hamburgers Quantity TVs Quantity Books Price ($) Hamburgers Price (S) TVs Year Price (S) 2015 Books Quantity 250 10 10 2 40 2016 300 20 12 6 3 60 2017 280 25 6 14 4 80 a. What is the percent change in production of each of the...
Inflation Names GDP DEFLATOR (IMPLICIT PRICE INDEX) price in 2015 quantity in 2015 goods Café Mochas...
 Inflation Names GDP DEFLATOR (IMPLICIT PRICE INDEX) price in 2015 quantity in 2015 goods Café Mochas police salaries imported computer price in 201 (dollars) 3.10 10,000 quantity in 2017 (dollars) 3.00 9,500 tin millions) in millions) 6.50 4.5 software Aspen Bay candles coal (used by electric 10 60 12 700 15 775 18 utility plants) Shoes Doritos 35 10 40 12 50 NOMINAL AND REAL GDP Calculate the nominal GDP for 2017. (remember the exceptions in calculating GDP) Calculate the...
The following two tables represent the price and quantity of the goods produced within an economy...
The following two tables represent the price and quantity of the goods produced within an economy in 2015 & 2016. Calculate the expenditure weights for each good using 2015 as the base year. What weight should be placed on soda in the aggregate expenditure index? (round to two decimal places) Prices Quantities 2015 2016 2015 2016 Soda $2 $2 36 40 Burgers $8 $12 8 10 French Fries $2 $1 16 20
GDP Inflation Deflator Rate YEAR CPI GDP %GDP | Real GDP | %RGDP (%CPI) |(2015-100) 2012...
 GDP Inflation Deflator Rate YEAR CPI GDP %GDP | Real GDP | %RGDP (%CPI) |(2015-100) 2012 231.2 95.43 1619 2013 234.72 97.11 16785 2014 236.27 98.94 17522 2015 237.83 100.00 18219 2016 242.7 01.09 1870 2017 247.91 103.02 19485 1. Calculate the annual inflation rate using the CPI. 2. Calculate the annual GDP growth rate using the GDP. 3. Explain how the inflation rate and the GDP growth have been moved. 4. Calculate the real GDP using GDP deflator by...
 DO #1
Real GDP is intended to measure the real value of goods and
services produced, not the stock of money, or the balance in your
bank account, or whether you are in debt or not. To do this, we may
use information on total expenditures - measured in dollars - but
the purpose is always to recover an index of real output. For this
homework, you need the following information to calculate real GDP
over several periods. First, you...
DO #1
Real GDP is intended to measure the real value of goods and
services produced, not the stock of money, or the balance in your
bank account, or whether you are in debt or not. To do this, we may
use information on total expenditures - measured in dollars - but
the purpose is always to recover an index of real output. For this
homework, you need the following information to calculate real GDP
over several periods. First, you...
 DO#3
Real GDP is intended to measure the real value of goods and
services produced, not the stock of money, or the balance in your
bank account, or whether you are in debt or not. To do this, we may
use information on total expenditures - measured in dollars - but
the purpose is always to recover an index of real output. For this
homework, you need the following information to calculate real GDP
over several periods. First, you know...
DO#3
Real GDP is intended to measure the real value of goods and
services produced, not the stock of money, or the balance in your
bank account, or whether you are in debt or not. To do this, we may
use information on total expenditures - measured in dollars - but
the purpose is always to recover an index of real output. For this
homework, you need the following information to calculate real GDP
over several periods. First, you know...
 DO #4
Real GDP is intended to measure the real value of goods and
services produced, not the stock of money, or the balance in your
bank account, or whether you are in debt or not. To do this, we may
use information on total expenditures - measured in dollars - but
the purpose is always to recover an index of real output. For this
homework, you need the following information to calculate real GDP
over several periods. First, you...
DO #4
Real GDP is intended to measure the real value of goods and
services produced, not the stock of money, or the balance in your
bank account, or whether you are in debt or not. To do this, we may
use information on total expenditures - measured in dollars - but
the purpose is always to recover an index of real output. For this
homework, you need the following information to calculate real GDP
over several periods. First, you...
 1. Describe, in your own words, the Laspeyres Index, the Paasche
Index, and the Fisher Index (chain-weighting).
2. Consider a country that only produces cars, cantaloupes, and
catamarans. Complete the following table by filling in the missing
entries.
3. Calculate the inflation rate for the 2014-15 period using the
GDP deflator based on the Laspeyres Index, the Paasche Index, and
the Fisher (chain-weighted) Index.
ercent change FY2014-15 FY 2014 FY 2015 Number of cars produced 100 125 Quintals of cantaloupes...
1. Describe, in your own words, the Laspeyres Index, the Paasche
Index, and the Fisher Index (chain-weighting).
2. Consider a country that only produces cars, cantaloupes, and
catamarans. Complete the following table by filling in the missing
entries.
3. Calculate the inflation rate for the 2014-15 period using the
GDP deflator based on the Laspeyres Index, the Paasche Index, and
the Fisher (chain-weighted) Index.
ercent change FY2014-15 FY 2014 FY 2015 Number of cars produced 100 125 Quintals of cantaloupes...
 5. Real versus nominal GDP Consider a simple economy that produces two goods: pens and envelopes. The following table shows the prices and quantities of the goods over a three-year period Pens Price Quantity (Dollars per pen) (Number of pens) 1 110 Envelopes Price Quantity (Dollars per envelope) (Number of envelopes) 180 Year 2015 4 2015 140 210 2 2017 4 100 190 4 Use the information from the preceding table to fill in the following table. Nominal GDP (Dollars)...
 5. The economy of Britannica produces three Year Computers DVDs Pizzas goods: computers, DVDs, and pizza. The Price Quantity Price Quantity Price Quantity accompanying table shows the prices and 2010 $900 10 $10 100 15 2 output of the three goods for the years 2011 1,000 10.5 12 105 16 2 2012 1,050 12 14 110 2010, 2011, and 2012. a. Calculate nominal GDP in Britannica for each of the three years. What is the per- cent change in nominal...
 2. Consider a hypothetical economy which produces three goods: TVs, books, and hamburgers. The following table shows the prices and output of the three goods for the years 2015, 2016, and 2017. Hamburgers Quantity TVs Quantity Books Price ($) Hamburgers Price (S) TVs Year Price (S) 2015 Books Quantity 250 10 10 2 40 2016 300 20 12 6 3 60 2017 280 25 6 14 4 80 a. What is the percent change in production of each of the...
 Inflation Names GDP DEFLATOR (IMPLICIT PRICE INDEX) price in 2015 quantity in 2015 goods Café Mochas police salaries imported computer price in 201 (dollars) 3.10 10,000 quantity in 2017 (dollars) 3.00 9,500 tin millions) in millions) 6.50 4.5 software Aspen Bay candles coal (used by electric 10 60 12 700 15 775 18 utility plants) Shoes Doritos 35 10 40 12 50 NOMINAL AND REAL GDP Calculate the nominal GDP for 2017. (remember the exceptions in calculating GDP) Calculate the...
 GDP Inflation Deflator Rate YEAR CPI GDP %GDP | Real GDP | %RGDP (%CPI) |(2015-100) 2012 231.2 95.43 1619 2013 234.72 97.11 16785 2014 236.27 98.94 17522 2015 237.83 100.00 18219 2016 242.7 01.09 1870 2017 247.91 103.02 19485 1. Calculate the annual inflation rate using the CPI. 2. Calculate the annual GDP growth rate using the GDP. 3. Explain how the inflation rate and the GDP growth have been moved. 4. Calculate the real GDP using GDP deflator by...
Most questions answered within 3 hours.
-
C - Language
Write a loop that sets each array element to the sum of itself...
asked 28 minutes ago -
(63
#14)
which of the following statments best describes how chamging
the concentration of the substances...
asked 3 hours ago -
In the following reaction, which element is undergoing
oxidation: Na2SO3 + N2O --> N2 + Na2SO4...
asked 4 hours ago -
Which of the following pairs of ions have the same electron
configuration?
I: Br− and Se2−...
asked 7 hours ago -
The Foremost Composite Materials Company is planning a two-day
sales conference for October 19-20. The conference...
asked 7 hours ago -
3) Illustrate the observed pattern of relatedness of organisms
versus adaptations to specific conditions. This means...
asked 8 hours ago -
In winter a lake has a 0.35 m thick ice layer over 1.10 m of
water....
asked 8 hours ago -
Assuming the following has been encrypted with a Vigenere cipher
below, use the method(s) and assumptions...
asked 9 hours ago -
How would I use switch statements to write a program that will
take an input of...
asked 9 hours ago -
Imagine a reaction in which methane gas combusts at a constant
pressure of 1 atm and...
asked 9 hours ago -
Two parallel wires (each 12 m in length) are separated by a
distance of 0.065 m...
asked 9 hours ago -
Suppose there were three masses at the corner of uniform
equilateral triangle. The masses are m1...
asked 9 hours ago