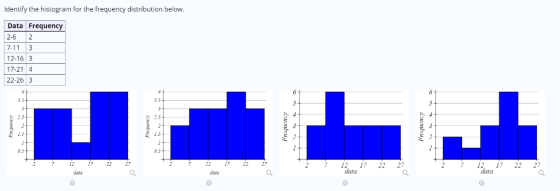
Identify the histogram for the frequency distribution below.
| Data | Frequency |
| 2-6 | 2 |
| 7-11 | 3 |
| 12-16 | 3 |
| 17-21 | 4 |
| 22-26 | 3 |
Homework Answers

Add Answer to:
Identify the histogram for the frequency distribution below.
Data
Frequency
2-6
2
7-11
3
12-16
3...
6) Draw a histogram for the frequency distribution in #5: or questions #7 – 10, use...
 6) Draw a histogram for the frequency distribution in #5: or questions #7 – 10, use the data below: 15 8 27 10 23 14 7 13 12 8 10 9 15 17 6 14 11 18 14 25 7) Construct a grouped frequency distribution for the data above.
Use the given data to construct a frequency distribution. 11) The number of people treated in...
Use the given data to construct a frequency distribution. 11) The number of people treated in the emergency service of a hospital every day of November was 15 23 12 10 28 7 12 17 20 21 18 13 11 12 26 6 16 19 22 14 17 21 28 9 16 13 11 16 20
7. Construct one table that includes relative frequencies based on the frequency distributions shown below, then...
7. Construct one table that includes relative frequencies based on the frequency distributions shown below, then compare the amounts of tar in nonfiltered and filtered cigarettes. Do the cigarette filters appear to be effective? (Hint: The filters reduce the amount of tar ingested by the smoker.) Complete the relative frequency table below. Tar (mg) Relative Frequency (Nonfiltered) Relative Frequency (Filtered) 2- 6 % % 7-11 % % 12- 16 % % 17- 21 % % 22- 26 % % 27-...
Example (H.W): You have the following data: 8 6 11 14 10 11 9 7 2...
Example (H.W): You have the following data: 8 6 11 14 10 11 9 7 2 8 9 5 5 5 12 7 8 4 17 8 12 7 8 8 7 10 8 6 9 9 11 16 2 7 4 8 4 4 5 5 9 9 6 6 7 7 9 5 4 5 14 2 9 0 6 1 1 12 11 4 1. Construct a frequency distribution for these data. 2. Develop a relative frequency...
1. Given the following data: years 0-9 10-19 20-29 frequency 4 6 8 a. Identify lower...
 1. Given the following data: years 0-9 10-19 20-29 frequency 4 6 8 a. Identify lower class limits b. Identify upper class limits c. Identify the class boundaries 2. Given the following data: Cigarette CO (mg) Frequency 2-6 7-11 2 12-16 6 17-21 8 a. Identify the class width b. Identify the class midpoints c. Does the frequency distribution appear to have a normal distribution? 3. Histogram Cigarette Tar Frequency Table Tar (mg) Freq. 2-5 6-9 2 10-13 6 14-17...
please explain 1-3 in detail, thank you! all data below Paragraph Histogram of height Styles 10...
 please explain 1-3 in detail, thank you! all data below
Paragraph Histogram of height Styles 10 Frequency 10 10 170 height 1. describe the histogram using the four characteristics: shape, center, variability(spread) and outliers. Use full sentences for the description. 2. Define the parameter being estimated in this histogram. 3. State and check the assumptions for the 95% confidence interval for the population mean. Make sure to explain why the assumptions are met or not. A check mark is not...
please explain 1-3 in detail, thank you! all data below
Paragraph Histogram of height Styles 10 Frequency 10 10 170 height 1. describe the histogram using the four characteristics: shape, center, variability(spread) and outliers. Use full sentences for the description. 2. Define the parameter being estimated in this histogram. 3. State and check the assumptions for the 95% confidence interval for the population mean. Make sure to explain why the assumptions are met or not. A check mark is not...
Consider the data in the following frequency distribution. Assume the data represent a sample. Class Frequency...
Consider the data in the following frequency distribution. Assume the data represent a sample. Class Frequency 12-16 12 17-21 23 22-26 14 27-31 21 What is the variance?
13 12 11 10 8 6 7 P 5 P 4 3 r 1 2 MarvelUS...
 13 12 11 10 8 6 7 P 5 P 4 3 r 1 2 MarvelUS is a service that streams shows and movies over the internet. As a new subscriber, Gary counted the number of episodes that are available through the service for a selection of his favorite shows. The histogram below summarizes the data. Use the histogram to answer each of the questions. (a) How many shows have from 11 to 16 episodes available? Frequency (Number of shows)...
frequency table histogram frequency polygon ogive 100% (?) New Open Save Print Import Copy Paste Format...
 frequency table histogram frequency polygon
ogive
100% (?) New Open Save Print Import Copy Paste Format Undo Redo AutoSum Sort A-Z Sort Z-A Gallery Toolbox Zoom Help Charts SmartArt Gr Word Protein Grams In Fast Food 223 3 25 12 38 22 21 427 27 1429 27 42 34 35 23 12 27 29 15 31 6 30 7 15 57 35 9 35 10 20 11 18 12 24 20 26 19 35 Tasks 1. Complete the fequency table...
frequency table histogram frequency polygon
ogive
100% (?) New Open Save Print Import Copy Paste Format Undo Redo AutoSum Sort A-Z Sort Z-A Gallery Toolbox Zoom Help Charts SmartArt Gr Word Protein Grams In Fast Food 223 3 25 12 38 22 21 427 27 1429 27 42 34 35 23 12 27 29 15 31 6 30 7 15 57 35 9 35 10 20 11 18 12 24 20 26 19 35 Tasks 1. Complete the fequency table...
 6) Draw a histogram for the frequency distribution in #5: or questions #7 – 10, use the data below: 15 8 27 10 23 14 7 13 12 8 10 9 15 17 6 14 11 18 14 25 7) Construct a grouped frequency distribution for the data above.
 1. Given the following data: years 0-9 10-19 20-29 frequency 4 6 8 a. Identify lower class limits b. Identify upper class limits c. Identify the class boundaries 2. Given the following data: Cigarette CO (mg) Frequency 2-6 7-11 2 12-16 6 17-21 8 a. Identify the class width b. Identify the class midpoints c. Does the frequency distribution appear to have a normal distribution? 3. Histogram Cigarette Tar Frequency Table Tar (mg) Freq. 2-5 6-9 2 10-13 6 14-17...
 please explain 1-3 in detail, thank you! all data below
Paragraph Histogram of height Styles 10 Frequency 10 10 170 height 1. describe the histogram using the four characteristics: shape, center, variability(spread) and outliers. Use full sentences for the description. 2. Define the parameter being estimated in this histogram. 3. State and check the assumptions for the 95% confidence interval for the population mean. Make sure to explain why the assumptions are met or not. A check mark is not...
please explain 1-3 in detail, thank you! all data below
Paragraph Histogram of height Styles 10 Frequency 10 10 170 height 1. describe the histogram using the four characteristics: shape, center, variability(spread) and outliers. Use full sentences for the description. 2. Define the parameter being estimated in this histogram. 3. State and check the assumptions for the 95% confidence interval for the population mean. Make sure to explain why the assumptions are met or not. A check mark is not...
 13 12 11 10 8 6 7 P 5 P 4 3 r 1 2 MarvelUS is a service that streams shows and movies over the internet. As a new subscriber, Gary counted the number of episodes that are available through the service for a selection of his favorite shows. The histogram below summarizes the data. Use the histogram to answer each of the questions. (a) How many shows have from 11 to 16 episodes available? Frequency (Number of shows)...
 frequency table histogram frequency polygon
ogive
100% (?) New Open Save Print Import Copy Paste Format Undo Redo AutoSum Sort A-Z Sort Z-A Gallery Toolbox Zoom Help Charts SmartArt Gr Word Protein Grams In Fast Food 223 3 25 12 38 22 21 427 27 1429 27 42 34 35 23 12 27 29 15 31 6 30 7 15 57 35 9 35 10 20 11 18 12 24 20 26 19 35 Tasks 1. Complete the fequency table...
frequency table histogram frequency polygon
ogive
100% (?) New Open Save Print Import Copy Paste Format Undo Redo AutoSum Sort A-Z Sort Z-A Gallery Toolbox Zoom Help Charts SmartArt Gr Word Protein Grams In Fast Food 223 3 25 12 38 22 21 427 27 1429 27 42 34 35 23 12 27 29 15 31 6 30 7 15 57 35 9 35 10 20 11 18 12 24 20 26 19 35 Tasks 1. Complete the fequency table...
Most questions answered within 3 hours.
-
Identify 3 research scenarios that might provide a low,
medium, and high degree of variability in...
asked 6 minutes ago -
how
does gravity affect the trajectory of projectile? what would be the
shape of the trajactory...
asked 56 minutes ago -
Two small plastic spheres are given positive electrical charges.
When they are a distance of 15.4...
asked 1 hour ago -
An acidic solution containing gold ions is
electrolyzed, producing gaseous oxygen (from water) at the anode...
asked 1 hour ago -
Assume that the population of Mexico is 128
million and that the population increases 1.01
percentannually....
asked 2 hours ago -
Can someone please help me add appropriate descriptive
comments to each line of code in the...
asked 2 hours ago -
Romeo wishes to throw a bouquet of flowers to Juliet, who is on
a second-story balcony,...
asked 3 hours ago -
Why is QE a controversial monetary policy tool.
A. It may lead to excessive inflation.B. By...
asked 3 hours ago -
Principles of Programming midterm study guide help!
1.)
______ Which of the following would reference the...
asked 3 hours ago -
A finite potential well has depth U0 = 2.78 eV . What is the
penetration distance...
asked 4 hours ago -
1. The bus bars of a power station are in two sections A and B
separated...
asked 4 hours ago -
Fiscal policy is the deliberate manipulation of taxes and
government spending to alter GDP, employment, inflation...
asked 4 hours ago