Problem 13-1A (Part Level Submission) Here are comparative statement data for Sandhill Company and Carla Vista...
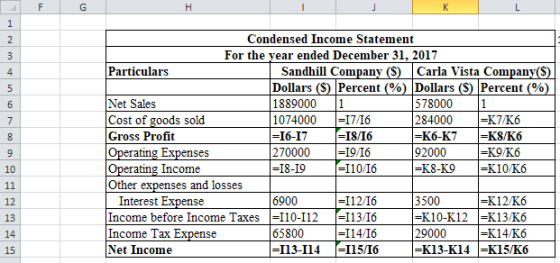
Problem 13-1A (Part Level Submission) Here are comparative statement data for Sandhill Company and Carla Vista Company, two competitors. All balance sheet data are as of December 31, 2017, and December 31, 2016. Sandhill Company Carla Vista Company 2017 2016 2017 2016 Net sales $1,889,000 $578,000 Cost of goods sold 1,074,000 284,000 Operating expenses 270,000 92,000 Interest expense 6,900 3,500 Income tax expense 65,800 29,000 Current assets 590,015 $565,462 150,838 $ 143,835 Plant assets (net) 953,508 905,000 252,908 227,720 Current liabilities 120,048 137,225 63,980 54,809 Long-term liabilities 206,322 162,900 53,612 45,250 Common stock, $10 par 905,000 905,000 217,200 217,200 Retained earnings 312,153 265,337 68,954 54,296 (a) Prepare a vertical analysis of the 2017 income statement data for Sandhill Company and Carla Vista Company. (Round all ratios to 1 decimal place, e.g. 2.5%.) Condensed Income Statement For the Year Ended December 31, 2017 Sandhill Company Carla Vista Company Dollars Percent Dollars Percent $1,889,000 % $578,000 % 1,074,000 % 284,000 % 815,000 % 294,000 % 270,000 % 92,000 % 545,000 % 202,000 % 6,900 % 3,500 % 538,100 % 198,500 % 65,800 % 29,000 % $472,300 % $169,500 %
Homework Answers
a) Vertical Analysis of Income Statement:

Excel formulas:
Add Answer to:
Problem 13-1A (Part Level Submission) Here are comparative
statement data for Sandhill Company and Carla Vista...
Problem 13-1A (Part Level Submission) Here are comparative statement data for Sandhill Company and Carla Vista...
Problem 13-1A (Part Level Submission) Here are comparative statement data for Sandhill Company and Carla Vista Company, two competitors. All balance sheet data are as of December 31, 2017, and December 31, 2016. Sandhill Company Carla Vista Company 2017 2016 2017 2016 Net sales $1,889,000 $578,000 Cost of goods sold 1,074,000 284,000 Operating expenses 270,000 92,000 Interest expense 6,900 3,500 Income tax expense 65,800 29,000 Current assets 590,015 $565,462 150,838 $ 143,835 Plant assets (net) 953,508 905,000 252,908 227,720 Current...
CALCULATOR PRINTER VER Problem 13-1A (Part Level Submission) Here are comparative statement data for Wildhorse Company...
 CALCULATOR PRINTER VER Problem 13-1A (Part Level Submission) Here are comparative statement data for Wildhorse Company and Sandhill Company, two competitors. All balance sheet data are as of December 31, 2017, and December 31, 2016. Wildhorse Company Net sales Cost of goods sold Operating expenses Interest expense Income tax expense 2017 $1,899,000 1,062,000 259,000 6,900 69,600 Sandhill Company 2017 $578,000 297,000 88,000 2,500 29,000 Current assets Plant assets (net) Current liabilities Long-term liabilities 518,300 837,612 105,457 181,244 $496,732 795,000 120,545...
Problem 13-1A (Part Level Submission) Here are comparative statement data for Wildhorse Company and Sandhill Company,...
 Problem 13-1A (Part Level Submission) Here are comparative statement data for Wildhorse Company and Sandhill Company, two competitors. All balance sheet data are as of December 31, 2017, and December 31, 2016. Net sales Cost of goods sold Operating expenses Interest expense Income tax expense Wildhorse Company 2017 2016 $1,892,000 1,075,000 260,000 8,200 65,300 Sandhill Company 2017 2016 $580,000 298,000 87,000 2,200 29,000 Current assets Plant assets (net) Current liabilities Long-term liabilities 498,742 806,004 101,477 174,405 $477,987 765,000 115,997 137,700...
Problem 13-1A (Part Level Submission) Here are comparative statement data for Crane Company and Sheridan Company,...
 Problem 13-1A (Part Level Submission) Here are comparative statement data for Crane Company and Sheridan Company, two competitors. All balance sheet data are as of December 31, 2017, and December 31, 2016 Crane Company Sheridan Company 2017 2016 2017 2016 Net sales Cost of goods sold Operating expenses Interest expense Income tax expense $1,855,000 1,063,000 265,000 8,600 74,900 $596,000 291,000 89,000 3,200 35,000 Current assets Plant assets (net) Current liabilities Long-term liabilities 534,599 $512,352 136,671 $ 130,326 863,952 820,000 229,154...
Problem 13-1A (Part Level Submission) Here are comparative statement data for Cullumber Company and Oriole Company,...
 Problem 13-1A (Part Level Submission) Here are comparative statement data for Cullumber Company and Oriole Company, two competitors. All balance sheet data are as of December 31, 2017, and December 31, 2016. Oriole Company 2017 2016 Net sales Cost of goods sold Operating expenses Interest expense Income tax expense Cullumber Company 2017 2016 $1,873,000 1,062,000 254,000 7,200 $599,000 299,000 89,000 3,400 74,900 34,000 Current assets Plant assets (net) Current liabilities Long-term liabilities 775,820 1,253,784 157,853 271,296 $743,536 1,190,000 180,440 214,200...
During 2015, Carla Vista Company purchased a building site for its proposed research and development laboratory at a cost of $63,000. Construction of the building was started in 2015. The building was...
 During 2015, Carla Vista Company purchased a building site for
its proposed research and development laboratory at a cost of
$63,000. Construction of the building was started in 2015. The
building was completed on December 31, 2016, at a cost of $440,000
and was placed in service on January 2, 2017. The estimated useful
life of the building for depreciation purposes was 20 years. The
straight-line method of depreciation was to be employed, and there
was no estimated residual value....
During 2015, Carla Vista Company purchased a building site for
its proposed research and development laboratory at a cost of
$63,000. Construction of the building was started in 2015. The
building was completed on December 31, 2016, at a cost of $440,000
and was placed in service on January 2, 2017. The estimated useful
life of the building for depreciation purposes was 20 years. The
straight-line method of depreciation was to be employed, and there
was no estimated residual value....
Problem 14-1A a, b1 (Part Level Submission) Here are comparative statement data for Duke Company and...
 Problem 14-1A a, b1 (Part Level Submission) Here are comparative statement data for Duke Company and Lord Company, two competitors. All balance sheet data are as of December 31, 2020, and December 31, 2019. Duke Company Lord Company 2020 2019 2020 2019 Net sales $561,000 297,330 79,101 3,927 6,732 Cost of goods sold Operating expenses Interest expense Income tax expense Current assets Plant assets (net) Current liabilities Long-term liabilities Common stock, $10 par Retained earnings $1,866,000 1,000,176 264,972 9,330 54,114...
Exercise 8-12 (Part Level Submission) Carla Company was formed on December 1, 2016. The following information...
 Exercise 8-12 (Part Level Submission)
Carla Company was formed on December 1, 2016. The following
information is available from Carla’s inventory records for Product
BAP. LIFO
Exercise 8-12 (Part Level Submission) Carla Company was formed on December 1, 2016. The following information is available from Carla's inventory records for Product BAP Units Unit Cost January 1, 2017 (beginning inventory) Purchases: 660 $9.00 January 5, 2017 January 25, 2017 February 16, 2017 March 26, 2017 1,320 1,430 880 660 10.00 11.00...
Exercise 8-12 (Part Level Submission)
Carla Company was formed on December 1, 2016. The following
information is available from Carla’s inventory records for Product
BAP. LIFO
Exercise 8-12 (Part Level Submission) Carla Company was formed on December 1, 2016. The following information is available from Carla's inventory records for Product BAP Units Unit Cost January 1, 2017 (beginning inventory) Purchases: 660 $9.00 January 5, 2017 January 25, 2017 February 16, 2017 March 26, 2017 1,320 1,430 880 660 10.00 11.00...
Vertical Analysis Problem 14-1A a, bi (Part Level Submission) Here are comparative statement data for Duke...
 Vertical Analysis
Problem 14-1A a, bi (Part Level Submission) Here are comparative statement data for Duke Company and Lord Company, two competitors. All balance sheet data are as of December 31, 2020, and December 31, 2019. Duke Company 2020 2019 Net sales Cost of goods sold Operating expenses Interest expense Income tax expense Current assets Plant assets (net) Current liabetes Long-term liabilities Common stock, 510 $1,878,000 1,100,508 261,042 9,390 54,462 329,000 519,900 65,400 108,800 499,500 175,200 Lord Company 2020 2019...
Vertical Analysis
Problem 14-1A a, bi (Part Level Submission) Here are comparative statement data for Duke Company and Lord Company, two competitors. All balance sheet data are as of December 31, 2020, and December 31, 2019. Duke Company 2020 2019 Net sales Cost of goods sold Operating expenses Interest expense Income tax expense Current assets Plant assets (net) Current liabetes Long-term liabilities Common stock, 510 $1,878,000 1,100,508 261,042 9,390 54,462 329,000 519,900 65,400 108,800 499,500 175,200 Lord Company 2020 2019...
Exercise 16-12 a-b (Part Level Submission) (Video) Sandhill Company has the following data at December 31, 2020....
 Exercise 16-12 a-b (Part Level Submission) (Video) Sandhill Company has the following data at December 31, 2020. Securities Cost Fair Value Trading $118,600 $123,200 Available-for-sale 103,800 90,600 The available-for-sale securities are held as a long-term investment. (a) (b) Indicate the statement presentation of each class of securities and the related unrealized gain (loss) ace Sandhill Company Balance Sheet (Partial) December 31, 2020 Current Assets 123200 Investments Sandhill Company Income Statement (Partial) December 31, 2020 Sandhill, Company Comprehensive Income Statement December...
 CALCULATOR PRINTER VER Problem 13-1A (Part Level Submission) Here are comparative statement data for Wildhorse Company and Sandhill Company, two competitors. All balance sheet data are as of December 31, 2017, and December 31, 2016. Wildhorse Company Net sales Cost of goods sold Operating expenses Interest expense Income tax expense 2017 $1,899,000 1,062,000 259,000 6,900 69,600 Sandhill Company 2017 $578,000 297,000 88,000 2,500 29,000 Current assets Plant assets (net) Current liabilities Long-term liabilities 518,300 837,612 105,457 181,244 $496,732 795,000 120,545...
 Problem 13-1A (Part Level Submission) Here are comparative statement data for Wildhorse Company and Sandhill Company, two competitors. All balance sheet data are as of December 31, 2017, and December 31, 2016. Net sales Cost of goods sold Operating expenses Interest expense Income tax expense Wildhorse Company 2017 2016 $1,892,000 1,075,000 260,000 8,200 65,300 Sandhill Company 2017 2016 $580,000 298,000 87,000 2,200 29,000 Current assets Plant assets (net) Current liabilities Long-term liabilities 498,742 806,004 101,477 174,405 $477,987 765,000 115,997 137,700...
 Problem 13-1A (Part Level Submission) Here are comparative statement data for Crane Company and Sheridan Company, two competitors. All balance sheet data are as of December 31, 2017, and December 31, 2016 Crane Company Sheridan Company 2017 2016 2017 2016 Net sales Cost of goods sold Operating expenses Interest expense Income tax expense $1,855,000 1,063,000 265,000 8,600 74,900 $596,000 291,000 89,000 3,200 35,000 Current assets Plant assets (net) Current liabilities Long-term liabilities 534,599 $512,352 136,671 $ 130,326 863,952 820,000 229,154...
 Problem 13-1A (Part Level Submission) Here are comparative statement data for Cullumber Company and Oriole Company, two competitors. All balance sheet data are as of December 31, 2017, and December 31, 2016. Oriole Company 2017 2016 Net sales Cost of goods sold Operating expenses Interest expense Income tax expense Cullumber Company 2017 2016 $1,873,000 1,062,000 254,000 7,200 $599,000 299,000 89,000 3,400 74,900 34,000 Current assets Plant assets (net) Current liabilities Long-term liabilities 775,820 1,253,784 157,853 271,296 $743,536 1,190,000 180,440 214,200...
 During 2015, Carla Vista Company purchased a building site for
its proposed research and development laboratory at a cost of
$63,000. Construction of the building was started in 2015. The
building was completed on December 31, 2016, at a cost of $440,000
and was placed in service on January 2, 2017. The estimated useful
life of the building for depreciation purposes was 20 years. The
straight-line method of depreciation was to be employed, and there
was no estimated residual value....
During 2015, Carla Vista Company purchased a building site for
its proposed research and development laboratory at a cost of
$63,000. Construction of the building was started in 2015. The
building was completed on December 31, 2016, at a cost of $440,000
and was placed in service on January 2, 2017. The estimated useful
life of the building for depreciation purposes was 20 years. The
straight-line method of depreciation was to be employed, and there
was no estimated residual value....
 Problem 14-1A a, b1 (Part Level Submission) Here are comparative statement data for Duke Company and Lord Company, two competitors. All balance sheet data are as of December 31, 2020, and December 31, 2019. Duke Company Lord Company 2020 2019 2020 2019 Net sales $561,000 297,330 79,101 3,927 6,732 Cost of goods sold Operating expenses Interest expense Income tax expense Current assets Plant assets (net) Current liabilities Long-term liabilities Common stock, $10 par Retained earnings $1,866,000 1,000,176 264,972 9,330 54,114...
 Exercise 8-12 (Part Level Submission)
Carla Company was formed on December 1, 2016. The following
information is available from Carla’s inventory records for Product
BAP. LIFO
Exercise 8-12 (Part Level Submission) Carla Company was formed on December 1, 2016. The following information is available from Carla's inventory records for Product BAP Units Unit Cost January 1, 2017 (beginning inventory) Purchases: 660 $9.00 January 5, 2017 January 25, 2017 February 16, 2017 March 26, 2017 1,320 1,430 880 660 10.00 11.00...
Exercise 8-12 (Part Level Submission)
Carla Company was formed on December 1, 2016. The following
information is available from Carla’s inventory records for Product
BAP. LIFO
Exercise 8-12 (Part Level Submission) Carla Company was formed on December 1, 2016. The following information is available from Carla's inventory records for Product BAP Units Unit Cost January 1, 2017 (beginning inventory) Purchases: 660 $9.00 January 5, 2017 January 25, 2017 February 16, 2017 March 26, 2017 1,320 1,430 880 660 10.00 11.00...
 Vertical Analysis
Problem 14-1A a, bi (Part Level Submission) Here are comparative statement data for Duke Company and Lord Company, two competitors. All balance sheet data are as of December 31, 2020, and December 31, 2019. Duke Company 2020 2019 Net sales Cost of goods sold Operating expenses Interest expense Income tax expense Current assets Plant assets (net) Current liabetes Long-term liabilities Common stock, 510 $1,878,000 1,100,508 261,042 9,390 54,462 329,000 519,900 65,400 108,800 499,500 175,200 Lord Company 2020 2019...
Vertical Analysis
Problem 14-1A a, bi (Part Level Submission) Here are comparative statement data for Duke Company and Lord Company, two competitors. All balance sheet data are as of December 31, 2020, and December 31, 2019. Duke Company 2020 2019 Net sales Cost of goods sold Operating expenses Interest expense Income tax expense Current assets Plant assets (net) Current liabetes Long-term liabilities Common stock, 510 $1,878,000 1,100,508 261,042 9,390 54,462 329,000 519,900 65,400 108,800 499,500 175,200 Lord Company 2020 2019...
 Exercise 16-12 a-b (Part Level Submission) (Video) Sandhill Company has the following data at December 31, 2020. Securities Cost Fair Value Trading $118,600 $123,200 Available-for-sale 103,800 90,600 The available-for-sale securities are held as a long-term investment. (a) (b) Indicate the statement presentation of each class of securities and the related unrealized gain (loss) ace Sandhill Company Balance Sheet (Partial) December 31, 2020 Current Assets 123200 Investments Sandhill Company Income Statement (Partial) December 31, 2020 Sandhill, Company Comprehensive Income Statement December...
Most questions answered within 3 hours.
-
Using Python:
A Prime number is an integer greater than 1 that cannot be
formed by...
asked 20 minutes ago -
Read about Cokes strategy in Africa in the article below and
discuss the ethics of selling...
asked 7 minutes ago -
What made of a 40.0% NaOH solution should be diluted to 1.00 L
with water to...
asked 7 minutes ago -
Draw and describe the results of the Meselson-Stahl experiments
showing that DNA replication followed the Semi-conservative...
asked 12 minutes ago -
Deeply Explain the Following Web Development Softwares Along
With the Reasons to Choose them For Development....
asked 9 minutes ago -
essay question: why was Hurricane Katrina so devastating? How
and why did the levees break in...
asked 14 minutes ago -
Why might it be necessary to reduce consumer spending in order
to attain faster economic growth?...
asked 23 minutes ago -
Express your answer with the appropriate units.
1. How many milliliters of oxygen gas at STP...
asked 29 minutes ago -
A
solution is prepared by mixing 0.12L of 0.11 M sodium chloride with
0.26 L of...
asked 30 minutes ago -
Difference between follicle and egg.
Where exactly are LH and FSH located on the ovaries?
What...
asked 31 minutes ago -
D8AC:
Discuss in 500 words or more why Oracle 12c has introduced two
new roles –...
asked 31 minutes ago -
1) Who is a Hispanic consumer?
2) Who is a Latin consumer?
3) Are Hispanic and...
asked 49 minutes ago