
Homework Answers


Add Answer to:
Consider
the following table which shows different
baskets of tennis balls:
(a) List all samples of...
Consider the following table which shows different baskets of tennis balls: Baskets Number of golf balls...
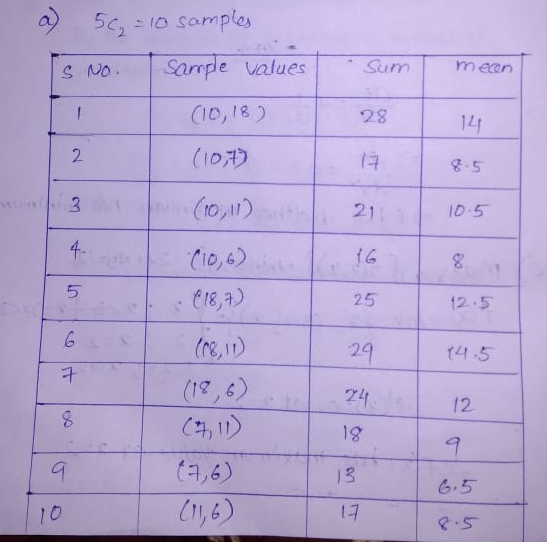
Consider the following table which shows different baskets of tennis balls: Baskets Number of golf balls (Population) 1 10 2 18 3 7 4 11 5 6 (a) List all samples of size 2, and compute the mean of each sample. (b) Compute the mean of the distribution of the sample mean and the population mean. Compare the two values. (c) Compare the dispersion in the population with that of the sample mean.
1. Consider the following table which shows different baskets of tennis balls: Number of golf balls...
 1. Consider the following table which shows different baskets of tennis balls: Number of golf balls Baskets (Population) 10 18 7 2 4 6 (a) List all samples of size 2, and compute the mean of each sample (b) Compute the mean of the distribution of the sample mean and the population mean. Compare the two values. (c) Compare the dispersion in the population with that of the sample mean.
1. Consider the following table which shows different baskets of tennis balls: Baskets Number of golf...
1. Consider the following table which shows different baskets of tennis balls: Baskets Number of golf balls (Population) 1 10 2 18 3 7 4 11 5 6 (a) List all samples of size 2, and compute the mean of each sample. (b) Compute the mean of the distribution of the sample mean and the population mean. Compare the two values. (c) Compare the dispersion in the population with that of the sample mean.
A population consists of the following fives values: 14, 15, 16, 18, 22. a. List all...
A population consists of the following fives values: 14, 15, 16, 18, 22. a. List all samples of size 3, and compute the mean of each sample. b. Compute the mean of the distribution of sample means and the population mean. Compare the two values. c. Compare the dispersion in the population with that of the sample means. Show your answer in the form of an Excel table.
A population consists of the following five values: 10, 14, 16, 18, and 19. a. List...
 A population consists of the following five values: 10, 14, 16, 18, and 19. a. List all samples of size 3, and compute the mean of each sample. (Round your mean value to 2 decimal places.) Sample Sum Mean 1 2 3 4 Values 10,14,16 10,14,18 10,14,19 10,16,18 10,16,19 14,16,18 14,16,19 16,18,19 5 6 7 00 9 10 b. Compute the mean of the distribution of sample means and the population mean. Compare the two values. (Round your answers to...
For the following situation, find the mean and standard deviation of the population. List all samples(with...
For the following situation, find the mean and standard deviation of the population. List all samples(with replacement) of the given size from that population. Find the mean and standard deviation of the sampling distribution and compare them with the mean and standard deviation of the population. The number of DVDs rented by each of three families in the past month is 6,11,and 4. Use a sample size of 2. The mean of the population is? The standard deviation of the...
Seved Help Save 2 A population consists of the following five values: 10, 12, 16, 18,...
 Seved Help Save 2 A population consists of the following five values: 10, 12, 16, 18, and 20. a. List all samples of size 3, and compute the mean of each sample. (Round your mean value to 2 decimal places.) 20 points Sample Valuos Sum Mean eBook 1 Ask 2 Print 4 References 6 7 10 b. Compute the mean of the distribution of sample means and the population mean. Compare the two values. (Round your answers to 2 decimal...
List all possible samples of size n=3, with replacement, from the population (1,3,5). Calculate the mean...
List all possible samples of size n=3, with replacement, from the population (1,3,5). Calculate the mean of each sample. Construct a probability distribution of the sample means and compute the mean, variance, and standard deviation of the sample means and compare to the mean, variance, and standard deviation of the population.
Consider a population consisting of the following five values, which represent the number of DVD rentals...
 Consider a population consisting of the following five values, which represent the number of DVD rentals during the academic year for each of five housemates: 14 16 10 11 a. Compute the mean of this population. [5 pt b. Select a random sample of size 2 by writing the five numbers in this population on slips of paper, mixing them, and then selecting two. Compute the mean of your sample. [5 pt c. Repeatedly select samples of size 2, and...
Question 19 (8 points) Determine in each of the following situations whether the Central Limit Theorem...
 Question 19 (8 points) Determine in each of the following situations whether the Central Limit Theorem applies in order to conclude that sampling distribution of the sample mean, that X-NI 7-N (M, ) For each distribution, determine whether CLT applies. If it does not, then enter NA as your answer in the blank number that corresponds to the distribution number. If it does, then enter the shape of the sample means as your first item in a list, the mean...
 1. Consider the following table which shows different baskets of tennis balls: Number of golf balls Baskets (Population) 10 18 7 2 4 6 (a) List all samples of size 2, and compute the mean of each sample (b) Compute the mean of the distribution of the sample mean and the population mean. Compare the two values. (c) Compare the dispersion in the population with that of the sample mean.
 A population consists of the following five values: 10, 14, 16, 18, and 19. a. List all samples of size 3, and compute the mean of each sample. (Round your mean value to 2 decimal places.) Sample Sum Mean 1 2 3 4 Values 10,14,16 10,14,18 10,14,19 10,16,18 10,16,19 14,16,18 14,16,19 16,18,19 5 6 7 00 9 10 b. Compute the mean of the distribution of sample means and the population mean. Compare the two values. (Round your answers to...
 Seved Help Save 2 A population consists of the following five values: 10, 12, 16, 18, and 20. a. List all samples of size 3, and compute the mean of each sample. (Round your mean value to 2 decimal places.) 20 points Sample Valuos Sum Mean eBook 1 Ask 2 Print 4 References 6 7 10 b. Compute the mean of the distribution of sample means and the population mean. Compare the two values. (Round your answers to 2 decimal...
 Consider a population consisting of the following five values, which represent the number of DVD rentals during the academic year for each of five housemates: 14 16 10 11 a. Compute the mean of this population. [5 pt b. Select a random sample of size 2 by writing the five numbers in this population on slips of paper, mixing them, and then selecting two. Compute the mean of your sample. [5 pt c. Repeatedly select samples of size 2, and...
 Question 19 (8 points) Determine in each of the following situations whether the Central Limit Theorem applies in order to conclude that sampling distribution of the sample mean, that X-NI 7-N (M, ) For each distribution, determine whether CLT applies. If it does not, then enter NA as your answer in the blank number that corresponds to the distribution number. If it does, then enter the shape of the sample means as your first item in a list, the mean...
Most questions answered within 3 hours.
-
if a firm producing 100 units at $5.00 each experience
an 80% experience curve, what will...
asked 5 minutes ago -
A solid, uniform disk of radius 0.250 m and mass 53.7 kg rolls
down a ramp...
asked 2 hours ago -
Given the following table of high speed internet access vs.
annual home income:
Home Income
%...
asked 2 hours ago -
A baseball batter hits a 0.145kg baseball straight up into the
air. The baseball leaves the...
asked 3 hours ago -
An FM modulator is tested using
single-tone baseband signal with frequency of 50kHz and a sprectrum...
asked 3 hours ago -
Write the ionic equations for the first stage of salts
hydrolysis.
Anion, Cation?
Na2S
NiSO4
K2SO4...
asked 5 hours ago -
suppose there is a normally distributed population with a mean of
250 and a standard deviation...
asked 6 hours ago -
Question Three
Suppose you as project manager are using the Waterfall
development methodology on a large...
asked 6 hours ago -
Which statement is not true about welfare in Canada?
A.Benefits typically vary based on one's ability...
asked 7 hours ago -
Please help me with FLOWCHART and UML diagram for class,
thank you!
#include <iostream>
#include <fstream>...
asked 8 hours ago -
3. Describe the “logic circuit” of the Lac operon. Which
proteins are bound or not to...
asked 8 hours ago -
Ayesha’s adjusted gross income is $60,000 in 2019. She donated a
piece of artwork with a...
asked 8 hours ago