
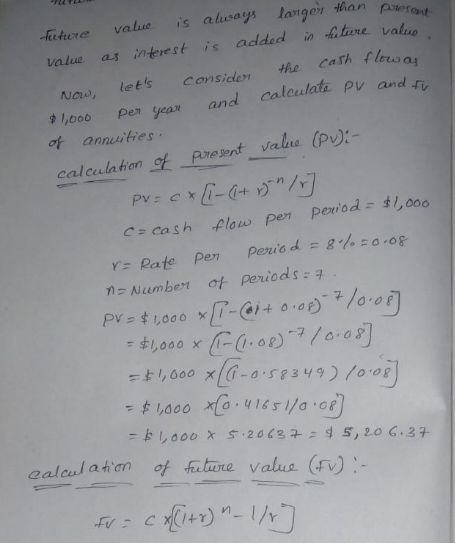
Consider the following cash flow diagrams. In these diagrams the present value (P) and the future value (F) are economically equivalent to the uniform series of payments (A) at a discount rate of 8% per period. Is the value of P larger than F, equal to F, or less than F?
Homework Answers


Add Answer to:
Consider the following cash flow diagrams. In these diagrams the
present value (P) and the future...
Consider the following cash flow diagrams. In these diagrams the present value (P) and the future...
 Consider the following cash flow diagrams. In these diagrams the present value (P) and the future value (F) are economically equivalent to the uniform series of payments (A) at a discount rate of 8% per period. Is the value of P larger than F, equal to F, or less than F? P is larger than F P equals F P is less than QUESTION 2 For the same cashflows considered in question 1, if the discount rate changed from 8%...
1. Consider cash flow diagrams A and B below. Determine the value of X so that...
 1. Consider cash flow diagrams A and B below. Determine the value of X so that both cash flow diagrams are equivalent at 10%/yr. Show your calculations. The diagrams are not drawn to scale, Your calculations for cash flow diagram A must include at least one uniform series factor. Your calculations for cash flow diagram B must include at least one gradient series factor
Calculate the value of T which makes the two cash flow diagrams economically equivalent (i.c. have...
 Calculate the value of T which makes the two cash flow diagrams economically equivalent (i.c. have the same present value) at an effective annual interest rate of 8%. $1,000 $1,000 2T 5500 $500 EOY EOY 3T
Calculate the value of T which makes the two cash flow diagrams economically equivalent (i.c. have...
 Calculate the value of T which makes the two cash flow diagrams economically equivalent (i.c. have the same present value) at an effective annual interest rate of 8%. 1,000 $1000 2T $500 $500 EOY EOY 3T
Problem 5: For the accompanying cash - flow diagram as shown in the following figure, find:...
 Problem 5: For the accompanying cash - flow diagram as shown in the following figure, find: I. The present worth value P. 2. The equivalent annual uniform series value A 3. The future worth value F 8% $200 S400 S600 $800 $1000 $1200 Good Luck
Are the following cash flow diagrams economically equivalent if the interest rate is 11% per year?...
 Are the following cash flow diagrams economically equivalent if the interest rate is 11% per year? M4M The left-hand diagram's discounted value at the EOY O is $ M. (Round to three decimal places) My
30 points) Cash flow diagrams required A makes the two cash flows equivalent at 12% interest...
 30 points) Cash flow diagrams required A makes the two cash flows equivalent at 12% interest rate compounded scount each CFD to present. The present value of the first cash flow is equal to Problem 3 of 3 What value of "Am yearly? Hint, discount the present value of the se esent value of the second cash flow A A A A A 120 120 120 100 100 0 1 5 years 2 3 4
Question Help Problem 4-65 (algorithmic) Are the following cash flow diagrams economically equivalent if the interest...
 Question Help Problem 4-65 (algorithmic) Are the following cash flow diagrams economically equivalent if the interest rate is 12% per year? MMM The left hand diagram's discounted value at the EOYO IS SIM (Round to three decimal places)
 Consider the following cash flow diagrams. In these diagrams the present value (P) and the future value (F) are economically equivalent to the uniform series of payments (A) at a discount rate of 8% per period. Is the value of P larger than F, equal to F, or less than F? P is larger than F P equals F P is less than QUESTION 2 For the same cashflows considered in question 1, if the discount rate changed from 8%...
 1. Consider cash flow diagrams A and B below. Determine the value of X so that both cash flow diagrams are equivalent at 10%/yr. Show your calculations. The diagrams are not drawn to scale, Your calculations for cash flow diagram A must include at least one uniform series factor. Your calculations for cash flow diagram B must include at least one gradient series factor
 1. Consider cash flow diagrams A and B below. Determine the value of X so that both cash flow diagrams are equivalent at 10%/yr. Show your calculations. The diagrams are not drawn to scale, Your calculations for cash flow diagram A must include at least one uniform series factor. Your calculations for cash flow diagram B must include at least one gradient series factor
 Calculate the value of T which makes the two cash flow diagrams economically equivalent (i.c. have the same present value) at an effective annual interest rate of 8%. $1,000 $1,000 2T 5500 $500 EOY EOY 3T
 Calculate the value of T which makes the two cash flow diagrams economically equivalent (i.c. have the same present value) at an effective annual interest rate of 8%. 1,000 $1000 2T $500 $500 EOY EOY 3T
 Calculate the value of T which makes the two cash flow diagrams economically equivalent (i.c. have the same present value) at an effective annual interest rate of 8%. 1,000 $1000 2T $500 $500 EOY EOY 3T
 Problem 5: For the accompanying cash - flow diagram as shown in the following figure, find: I. The present worth value P. 2. The equivalent annual uniform series value A 3. The future worth value F 8% $200 S400 S600 $800 $1000 $1200 Good Luck
 Are the following cash flow diagrams economically equivalent if the interest rate is 11% per year? M4M The left-hand diagram's discounted value at the EOY O is $ M. (Round to three decimal places) My
 30 points) Cash flow diagrams required A makes the two cash flows equivalent at 12% interest rate compounded scount each CFD to present. The present value of the first cash flow is equal to Problem 3 of 3 What value of "Am yearly? Hint, discount the present value of the se esent value of the second cash flow A A A A A 120 120 120 100 100 0 1 5 years 2 3 4
 Question Help Problem 4-65 (algorithmic) Are the following cash flow diagrams economically equivalent if the interest rate is 12% per year? MMM The left hand diagram's discounted value at the EOYO IS SIM (Round to three decimal places)
Most questions answered within 3 hours.
-
1. Add hydrochloric acid (HCl) to magnesium metal in a test
tube.
Observations: &
asked 3 minutes ago -
Calculate the volume in milliliters of a 1.4 mol/L barium
acetate solution that contains 200.g of...
asked 3 minutes ago -
A consumer can choose between two gambles. The “sure thing”
guaranteesadditional income (I) of $250,000. The...
asked 4 minutes ago -
There are 9 women and 6 men in a department. A committee of four
is to...
asked 6 minutes ago -
Arthur Meiners is the production manager of Wheel-Rite, a small
producer of metal parts. Wheel-Rite supplies...
asked 21 minutes ago -
Company Risk Premium A company has a beta of
4.57. If the market return is expected...
asked 19 minutes ago -
3. Which statement about nuclear fission is correct? (1
point)
A. Nuclear fission provides energy for...
asked 25 minutes ago -
If a $2,000 increase in income leads to a $1,5000 increase in
consumption expenditures, then the...
asked 25 minutes ago -
May you please put this in layman's terms?
ABSTRACT
Coagulase-negative staphylococci (CoNS) and Staphylococcus
aureus are...
asked 29 minutes ago -
If authentic leadership is really a lifelong process,
can teenagers be authentic leaders? Why or why...
asked 45 minutes ago -
Six years of quarterly data of a seasonally adjusted series are
used to estimate a linear...
asked 1 hour ago -
Which of the following is not an ecological model used
to foster behavior change?
PRECEDE-PROCEED Model...
asked 1 hour ago