Please help, help!!!!!!! Using the data given in the table, answer the question
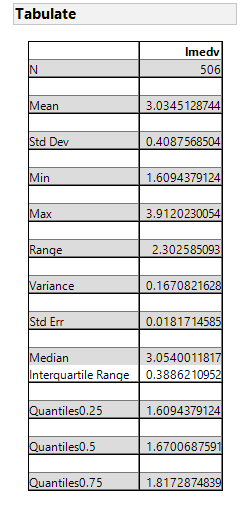
(a) Construct a 95% confidence interval for lmedv and test the hypothesis H0: mean lmedv = 3 vs. H1: mean lmedv > 3. What is the test statistic value, p-value and your conclusion of the test at α = 0.05? (Note that the confidence interval is two-sided while the test is one-sided.) lmdev being median value of owner-occupied homes in $1000's
(b) Let p = proportion of lmedv > 3.02 (i.e., lmedv2=1). Test H0: p = 0.5 vs. H1: p > 0.5 at α = 0.05.
Homework Answers
a)
Mean(x) = 3.034
n = 506
Std Dev(s) = 0.4087
Alpha = 0.05
ZCritical = 1.96
Hence,
95% CI = Mean +/- ZCritical * Std Dev / n1/2 = 3.034 +/- 1.96*0.4087/5061/2
= {2.998,3.070}
Null and Alternate Hypothesis
H0: µ = 3
Ha: µ > 3
Test Statistic
t = (x - µ0)/(s/n1/2) = (3.034-3) / ( 0.4087/5061/2) = 1.87
p-value = TDIST(1.87,506-1,1) = 0.030939
Result
Since the p-value is less than 0.05, we reject the null hypothesis.
b) Data is wrong as proportion is given to be 3.02 (It can never be greater than 1)
Add Answer to:
Please help, help!!!!!!! Using the data given in the table,
answer the question
(a) Construct a...
Help HW Some archaeologists theorize that ancient Egyptians interbred with several different immigrant populations over thousands...
 Help HW
Some archaeologists theorize that ancient Egyptians interbred
with several different immigrant populations over thousands of
years. To see if there is any indication of the change in body
structure that might have resulted, they measured a random sample
of 30 skulls of male Egyptians dated from 4000 B.C.E and a random
sample of 30 others dated from 200 B.C.E. and recorded the maximum
skull breadth, in millimeters.
(a) (1 pt) What is the explanatory variable? , (b) (1...
Help HW
Some archaeologists theorize that ancient Egyptians interbred
with several different immigrant populations over thousands of
years. To see if there is any indication of the change in body
structure that might have resulted, they measured a random sample
of 30 skulls of male Egyptians dated from 4000 B.C.E and a random
sample of 30 others dated from 200 B.C.E. and recorded the maximum
skull breadth, in millimeters.
(a) (1 pt) What is the explanatory variable? , (b) (1...
A study was conducted to evaluate the effectiveness of a weight loss program. Among 36 obese indi...
 A study was conducted to evaluate the effectiveness of a weight loss program. Among 36 obese individuals aged 55 to 75 years randomly selected into the study, each individual had his/her BMI computed before and after the program. The decrease in the BMI was recorded into a SAS dataset and proc univariate was used to analyze this dataset. The population m ean of the decrease in the BMI is denoted by μ. Use the SAS output on the following page...
Data Exploration 2. (10 pts) Use to JMP to estimate the 95% confidence interval for the...
 Data Exploration 2. (10 pts) Use to JMP to estimate the 95% confidence interval for the mean of both the dependent and independent variables. - Distributions - Price - Distributions - Mileage (km) 90000 Quantiles 100.0% maximum Quantiles 1000W maximum 209000 150278875 107553 18399,75 00.0% 75.0% quartile 25.0 quartie 74091 125 0.0% minimum Summary Statistics Mean Sad Dev Std Er Mean 301.65425 Upper 6% Mean 11001.677 Lower 95% Mean 98045825 minimum - Summary Statistics Maan 5209271 Std Dev SE Mean3658.5771...
C.37 – Grams of Fiber per Day Question C.37 is one of the review exercise questions...
 C.37 – Grams of Fiber per
Day
Question C.37 is one of the review exercise questions for Unit C
which is just after Chapter 6.
Use JMP to compute a 95% confidence interval (include output
from JMP, data provided on Canvas): (provided picture)
Interpret interval in the context of this study:
Hypothesis test: ? = 0.05
Hypothesis statements:
Compute test statistic (show calculations). Note that the sample
standard deviation = s = 5.33.
Find p-value using JMP (include output from...
C.37 – Grams of Fiber per
Day
Question C.37 is one of the review exercise questions for Unit C
which is just after Chapter 6.
Use JMP to compute a 95% confidence interval (include output
from JMP, data provided on Canvas): (provided picture)
Interpret interval in the context of this study:
Hypothesis test: ? = 0.05
Hypothesis statements:
Compute test statistic (show calculations). Note that the sample
standard deviation = s = 5.33.
Find p-value using JMP (include output from...
Based on the sample data, the P-value for a two-sided test of the null hypothesis H0:μ=10H0:μ=10...
Based on the sample data, the P-value for a two-sided test of the null hypothesis H0:μ=10H0:μ=10 vs. H1:μ≠10H1:μ≠10 is 0.06. Which of the following statements is correct? A. the 95% confidence interval includes the value 10 B. the 68% confidence interval includes the value 10 C. the 90% confidence interval includes the value 10 D. None of the above
I need help on question 5 and 6 and explaining it. Thank you Annual Salary in...
 I need help on question 5 and 6 and explaining it. Thank
you
Annual Salary in 5 Years Quantiles -Summary Statistics Δ. Confidence Intervals H S . . 1000% maximum 150 Mean 74.816667 Parameter Estimate Lower CI Upper CI 1-Alpha 74.81667 70.0473 79.58604 0.950 34.25 Std Err Mean 2.3834993 Std Dev 18.46251 15.64945 22.51802 0.950 18.462506 Mean 99.5% 97.5% 900% 75.0% 500% 250% 100% 2.5% 0.5% 50 Std Dev 100 Upper 95% Mean 79.586038 725 N 57.1 70047296 60 83.75...
I need help on question 5 and 6 and explaining it. Thank
you
Annual Salary in 5 Years Quantiles -Summary Statistics Δ. Confidence Intervals H S . . 1000% maximum 150 Mean 74.816667 Parameter Estimate Lower CI Upper CI 1-Alpha 74.81667 70.0473 79.58604 0.950 34.25 Std Err Mean 2.3834993 Std Dev 18.46251 15.64945 22.51802 0.950 18.462506 Mean 99.5% 97.5% 900% 75.0% 500% 250% 100% 2.5% 0.5% 50 Std Dev 100 Upper 95% Mean 79.586038 725 N 57.1 70047296 60 83.75...
Suppose a test of H0: μ = 0 vs. Ha: μ ≠ 0 is run with α = 0.05 and the P-value of the test is 0.052. Using the same data...
Suppose a test of H0: μ = 0 vs. Ha: μ ≠ 0 is run with α = 0.05 and the P-value of the test is 0.052. Using the same data, a confidence interval for μ is also constructed. (a) Of the following, which is the largest confidence level for which the confidence interval will not contain 0? 90% 94% 95% 96% 99% (b) Of the following, which is the smallest confidence level for which the confidence interval will contain...
Homes for Sale A real estate agent is interested in the current housing prices in a...
 Homes for Sale A real estate agent is interested in the current
housing prices in a particular neighborhood in New York. A random
sample of 30 homes for sale in the neighborhood was taken and the
current listed price of each home was recorded. The data can be
found in the JMP file “HomesForSale-NY-S2019.jmp”
(c) Report the degrees of
freedom associated with the t-distribution required to construct a
confidence interval for the mean for these data.
(d) Based on your...
Homes for Sale A real estate agent is interested in the current
housing prices in a particular neighborhood in New York. A random
sample of 30 homes for sale in the neighborhood was taken and the
current listed price of each home was recorded. The data can be
found in the JMP file “HomesForSale-NY-S2019.jmp”
(c) Report the degrees of
freedom associated with the t-distribution required to construct a
confidence interval for the mean for these data.
(d) Based on your...
Use the given statistics to complete parts (a) and (b). Assume that the populations are normally...
Use the given statistics to complete parts (a) and (b). Assume that the populations are normally distributed. Population 1 Population 2 n 26 16 x 49.8 40.1 s 6.8 13.2 (a) Test whether μ1 > μ2 at the α = 0.01 level of significance for the given sample data. (b) Construct a 90% confidence interval about μ1 − μ2 . (a) Identify the null and alternative hypotheses for this test. A. H0 : μ1 ≠...
PLEASE ANSWER CLEARLY Question Completion Status: One sample proportion summary confidence interval: P: Proportion of successes...
 PLEASE ANSWER CLEARLY
Question Completion Status: One sample proportion summary confidence interval: P: Proportion of successes Method: Standard-Wald 95% confidence interval results: Proportion Count Total Sample Prop. Std. Err. L. Limit U. Limit р 68 285 0.23859649 0.025247422 0.18911245 0.28808053 a. Identify the 95% confidence interval for this given scenario. a. 18.9% < < 28.8% o b. 18.9% < < 28.8% 18.9% < X < 28.8% C 95% confidence interval results: Proportion Count Total Sample Prop. Std. Err. L. Limit...
PLEASE ANSWER CLEARLY
Question Completion Status: One sample proportion summary confidence interval: P: Proportion of successes Method: Standard-Wald 95% confidence interval results: Proportion Count Total Sample Prop. Std. Err. L. Limit U. Limit р 68 285 0.23859649 0.025247422 0.18911245 0.28808053 a. Identify the 95% confidence interval for this given scenario. a. 18.9% < < 28.8% o b. 18.9% < < 28.8% 18.9% < X < 28.8% C 95% confidence interval results: Proportion Count Total Sample Prop. Std. Err. L. Limit...
 Help HW
Some archaeologists theorize that ancient Egyptians interbred
with several different immigrant populations over thousands of
years. To see if there is any indication of the change in body
structure that might have resulted, they measured a random sample
of 30 skulls of male Egyptians dated from 4000 B.C.E and a random
sample of 30 others dated from 200 B.C.E. and recorded the maximum
skull breadth, in millimeters.
(a) (1 pt) What is the explanatory variable? , (b) (1...
Help HW
Some archaeologists theorize that ancient Egyptians interbred
with several different immigrant populations over thousands of
years. To see if there is any indication of the change in body
structure that might have resulted, they measured a random sample
of 30 skulls of male Egyptians dated from 4000 B.C.E and a random
sample of 30 others dated from 200 B.C.E. and recorded the maximum
skull breadth, in millimeters.
(a) (1 pt) What is the explanatory variable? , (b) (1...
 A study was conducted to evaluate the effectiveness of a weight loss program. Among 36 obese individuals aged 55 to 75 years randomly selected into the study, each individual had his/her BMI computed before and after the program. The decrease in the BMI was recorded into a SAS dataset and proc univariate was used to analyze this dataset. The population m ean of the decrease in the BMI is denoted by μ. Use the SAS output on the following page...
 Data Exploration 2. (10 pts) Use to JMP to estimate the 95% confidence interval for the mean of both the dependent and independent variables. - Distributions - Price - Distributions - Mileage (km) 90000 Quantiles 100.0% maximum Quantiles 1000W maximum 209000 150278875 107553 18399,75 00.0% 75.0% quartile 25.0 quartie 74091 125 0.0% minimum Summary Statistics Mean Sad Dev Std Er Mean 301.65425 Upper 6% Mean 11001.677 Lower 95% Mean 98045825 minimum - Summary Statistics Maan 5209271 Std Dev SE Mean3658.5771...
 C.37 – Grams of Fiber per
Day
Question C.37 is one of the review exercise questions for Unit C
which is just after Chapter 6.
Use JMP to compute a 95% confidence interval (include output
from JMP, data provided on Canvas): (provided picture)
Interpret interval in the context of this study:
Hypothesis test: ? = 0.05
Hypothesis statements:
Compute test statistic (show calculations). Note that the sample
standard deviation = s = 5.33.
Find p-value using JMP (include output from...
C.37 – Grams of Fiber per
Day
Question C.37 is one of the review exercise questions for Unit C
which is just after Chapter 6.
Use JMP to compute a 95% confidence interval (include output
from JMP, data provided on Canvas): (provided picture)
Interpret interval in the context of this study:
Hypothesis test: ? = 0.05
Hypothesis statements:
Compute test statistic (show calculations). Note that the sample
standard deviation = s = 5.33.
Find p-value using JMP (include output from...
 I need help on question 5 and 6 and explaining it. Thank
you
Annual Salary in 5 Years Quantiles -Summary Statistics Δ. Confidence Intervals H S . . 1000% maximum 150 Mean 74.816667 Parameter Estimate Lower CI Upper CI 1-Alpha 74.81667 70.0473 79.58604 0.950 34.25 Std Err Mean 2.3834993 Std Dev 18.46251 15.64945 22.51802 0.950 18.462506 Mean 99.5% 97.5% 900% 75.0% 500% 250% 100% 2.5% 0.5% 50 Std Dev 100 Upper 95% Mean 79.586038 725 N 57.1 70047296 60 83.75...
I need help on question 5 and 6 and explaining it. Thank
you
Annual Salary in 5 Years Quantiles -Summary Statistics Δ. Confidence Intervals H S . . 1000% maximum 150 Mean 74.816667 Parameter Estimate Lower CI Upper CI 1-Alpha 74.81667 70.0473 79.58604 0.950 34.25 Std Err Mean 2.3834993 Std Dev 18.46251 15.64945 22.51802 0.950 18.462506 Mean 99.5% 97.5% 900% 75.0% 500% 250% 100% 2.5% 0.5% 50 Std Dev 100 Upper 95% Mean 79.586038 725 N 57.1 70047296 60 83.75...
 Homes for Sale A real estate agent is interested in the current
housing prices in a particular neighborhood in New York. A random
sample of 30 homes for sale in the neighborhood was taken and the
current listed price of each home was recorded. The data can be
found in the JMP file “HomesForSale-NY-S2019.jmp”
(c) Report the degrees of
freedom associated with the t-distribution required to construct a
confidence interval for the mean for these data.
(d) Based on your...
Homes for Sale A real estate agent is interested in the current
housing prices in a particular neighborhood in New York. A random
sample of 30 homes for sale in the neighborhood was taken and the
current listed price of each home was recorded. The data can be
found in the JMP file “HomesForSale-NY-S2019.jmp”
(c) Report the degrees of
freedom associated with the t-distribution required to construct a
confidence interval for the mean for these data.
(d) Based on your...
 PLEASE ANSWER CLEARLY
Question Completion Status: One sample proportion summary confidence interval: P: Proportion of successes Method: Standard-Wald 95% confidence interval results: Proportion Count Total Sample Prop. Std. Err. L. Limit U. Limit р 68 285 0.23859649 0.025247422 0.18911245 0.28808053 a. Identify the 95% confidence interval for this given scenario. a. 18.9% < < 28.8% o b. 18.9% < < 28.8% 18.9% < X < 28.8% C 95% confidence interval results: Proportion Count Total Sample Prop. Std. Err. L. Limit...
PLEASE ANSWER CLEARLY
Question Completion Status: One sample proportion summary confidence interval: P: Proportion of successes Method: Standard-Wald 95% confidence interval results: Proportion Count Total Sample Prop. Std. Err. L. Limit U. Limit р 68 285 0.23859649 0.025247422 0.18911245 0.28808053 a. Identify the 95% confidence interval for this given scenario. a. 18.9% < < 28.8% o b. 18.9% < < 28.8% 18.9% < X < 28.8% C 95% confidence interval results: Proportion Count Total Sample Prop. Std. Err. L. Limit...
Most questions answered within 3 hours.
-
Mark Gershon, owner of a musical instrument distributorship,
thinks that demand for guitars may be related...
asked 10 minutes ago -
Suppose that you were asked to construct a 95% confidence
interval based on the standard normal...
asked 18 minutes ago -
3 - What decimal number does the bit pattern 11001100 represent
if it is a:
•...
asked 20 minutes ago -
The copper(II) ion is acidic whereas the acetate ion is basic.
However, copper acetate is acidic....
asked 15 minutes ago -
A 48.53 mL volume of 1.00 M HCl was mixed with 47.70 mL of 2.00
M...
asked 37 minutes ago -
Neural cell types can be specified from ESCs with
retinoic acid, conditioned medium, co-cultures or by...
asked 42 minutes ago -
Can anyone solve: "Simulation with Arena 6th Edition - Chapter 8
- Question 3E"
8-3 Change...
asked 39 minutes ago -
What are some issues related to crimes, victims &
victimization that should be addressed?
asked 46 minutes ago -
Water flowing uniformly in a rectangular open channel has
manning value of 0.017, bottom slope of...
asked 1 hour ago -
Nature Conservancy's leader abruptly steps
down.
One morning in October 2007, Steven. J. McCormick the president...
asked 1 hour ago -
I asked a question similar to this one, which was answered
perfectly. Another practice problem is...
asked 1 hour ago -
Rachel is studying cholesterol synthesis in mice. Some mice
had a mutation in their sterol regulatory...
asked 1 hour ago