The data from data421.dat contains information on 78 seventh-grade students. We want to know how well...
The data from data421.dat contains information on 78 seventh-grade students. We want to know how well each of IQ score and self-concept score predicts GPA using least-squares regression. We also want to know which of these explanatory variables predicts GPA better. Give numerical measures that answer these questions. (Round your answers to three decimal places.)
find:(Regressor: IQ) R 2
find: (Regressor: Self-Concept) R 2


 obs  gpa     iq      gender  concept
1       7.94    103     2       54
2       8.292   111     2       73
3       4.643   114     2       39
4       7.47    115     2       69
5       8.882   111     1       47
6       7.585   115     2       76
7       7.65    111     2       63
8       2.412   92      2       30
9       6       100     1       41
10      8.833   115     2       53
11      7.47    116     1       57
12      5.528   96      1       41
13      7.167   105     2       61
14      7.571   116     1       59
15      4.7     80      1       64
16      8.167   116     1       58
17      7.822   102     1       64
18      7.598   123     1       41
19      4       93      2       53
20      6.231   101     1       48
21      7.643   101     2       67
22      1.76    85      2       37
24      6.419   101     1       60
26      9.648   115     2       86
27      10.7    135     1       80
28      10.58   132     2       80
29      9.429   111     2       59
30      8       110     2       73
31      9.585   115     2       70
32      9.571   125     1       74
33      8.998   106     1       44
34      8.333   117     1       73
35      8.175   115     2       57
36      8       117     2       57
37      9.333   125     1       63
38      9.5     125     2       92
39      9.167   89      2       65
40      10.14   120     1       82
41      9.999   113     1       89
43      10.76   124     2       77
44      9.763   107     2       64
45      9.41    121     2       67
46      9.167   110     2       72
47      9.348   105     2       73
48      8.167   123     2       77
50      3.647   89      2       29
51      3.408   102     1       44
52      3.936   93      2       56
53      7.167   113     2       44
54      7.647   105     2       59
55      .53     104     2       53
56      6.173   91      2       41
57      7.295   113     2       59
58      7.295   109     1       53
59      8.938   99      1       54
60      7.882   120     1       76
61      8.353   139     2       70
62      5.062   89      2       56
63      8.175   119     2       55
64      8.235   130     2       67
65      7.588   121     2       45
68      7.647   119     2       59
69      5.237   101     1       67
71      7.825   109     2       67
72      7.333   95      1       48
74      9.167   110     2       56
76      7.996   110     2       66
77      8.714   123     1       26
78      7.833   108     1       70
79      4.885   112     2       36
80      7.998   124     1       46
83      3.82    86      2       78
84      5.936   102     1       76
85      9       108     1       68
86      9.5     100     1       72
87      6.057   93      2       76
88      6.057   110     1       43
89      6.938   100     2       54
Homework Answers
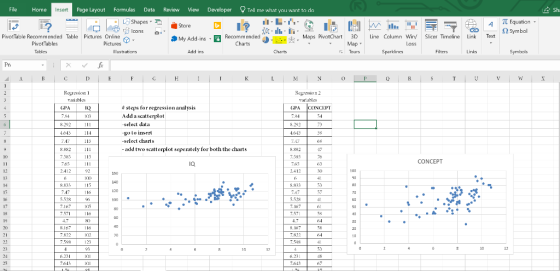
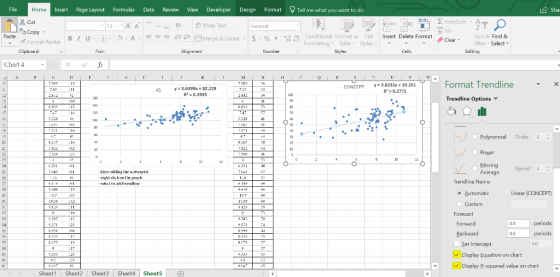
(Regressor: IQ) R 2 = 0.3935(Regressor: Self-Concept) R 2 = 0.2771
Add Answer to:
The data from data421.dat contains information on 78 seventh-grade students. We want to know how well...
The data from data349.dat contains information on 78 seventh-grade students. We want to know how well each of IQ score a...
The data from data349.dat contains information on 78 seventh-grade students. We want to know how well each of IQ score and self-concept score predicts GPA using least-squares regression. We also want to know which of these explanatory variables predicts GPA better. Give numerical measures that answer these questions. (Round your answers to three decimal places.) (Regressor: IQ) R 2 (Regressor: Self-Concept) R 2 Which variable is the better predictor? IQ Self Concept obs gpa iq gender concept 1 7.94 112 ...
The data from data95.dat contains information on 78 seventh-grade students. We want to know how well each of IQ score and self-concept score predicts GPA using least-squares regression. We also want t...
The data from data95.dat contains information on 78 seventh-grade students. We want to know how well each of IQ score and self-concept score predicts GPA using least-squares regression. We also want to know which of these explanatory variables predicts GPA better. Give numerical measures that answer these questions. (Round your answers to three decimal places.) (Regressor: IQ) R 2 : (Regressor: Self-Concept) R 2 : Which variable is the better predictor? IQSelf Concept obs gpa iq gender concept 1 7.94...
Make a graph of the distribution of IQ scores for the seventh-grade students in table 1.3....
 Make a graph of the distribution of IQ scores for the
seventh-grade students in table 1.3. Describe the shape, center,
and spread of the distribution as well as any outliers. IQ scores
are usually said to be centered at 100. Is the midpoint for these
students close to 100, clearly above, or clearly below?
TABLE 1.3 Educational Data for 78 Seventh-Grade Self- OBS Gender concept 123 GPA 8.292 4.643 7.470 8.882 7.585 10.760 9.763 9.410 9.167 9.348 8.167 107 046...
Make a graph of the distribution of IQ scores for the
seventh-grade students in table 1.3. Describe the shape, center,
and spread of the distribution as well as any outliers. IQ scores
are usually said to be centered at 100. Is the midpoint for these
students close to 100, clearly above, or clearly below?
TABLE 1.3 Educational Data for 78 Seventh-Grade Self- OBS Gender concept 123 GPA 8.292 4.643 7.470 8.882 7.585 10.760 9.763 9.410 9.167 9.348 8.167 107 046...
1.40 Describe the IQ scores. Make a graph of the distribution of IQ scores for the...
 1.40 Describe the IQ scores. Make a graph of the distribution of IQ scores for the seventh-grade students in Table 1.3. Describe the shape, center, and spread of the 26 Chapter 1 Looking at Data-Distributions TABLE 1.3 Educational Data for 78 Seventh-Grade Sltudents Educational Data for 78 Seventh-Grade Students OBS GPA 1O Gender concept I0 Genderconcept 7.940 8.292 4.643 7.470 8.882 7.585 7.650 2.412 6.000 10.760 9.763 003 9410 126 9.167 9.348 127 047 51 8.167 3.647 3.408 3.936 119...
Consider the below matrixA, which you can copy and paste directly into Matlab.
Problem #1: Consider the below matrix A, which you can copy and paste directly into Matlab. The matrix contains 3 columns. The first column consists of Test #1 marks, the second column is Test # 2 marks, and the third column is final exam marks for a large linear algebra course. Each row represents a particular student.A = [36 45 75 81 59 73 77 73 73 65 72 78 65 55 83 73 57 78 84 31 60 83...
For determining half-lives of radioactive isotopes, it is important to know what the background radiation is...
 For determining half-lives of radioactive isotopes, it is important to know what the background radiation is in a given detector over a specific period. The following data were taken in a y -ray detection experiment over 98 ten-second intervals: 58 50 57 58 64 63 54 64 59 41 43 56 60 50 46 59 54 60 59 60 67 52 65 63 55 61 68 58 63 36 42 54 58 54 40 60 64 56 61 51 48...
1. Forecast demand for Year 4. a. Explain what technique you utilized to forecast your demand....
 1. Forecast demand for Year 4.
a. Explain what technique you utilized to forecast your
demand.
b. Explain why you chose this technique over others.
Year 3 Year 1 Year 2 Actual Actual Actual Forecast Forecast Forecast Demand Demand Demand Week 1 52 57 63 55 66 77 Week 2 49 58 68 69 75 65 Week 3 47 50 58 65 80 74 Week 4 60 53 58 55 78 67 57 Week 5 49 57 64 76 77...
1. Forecast demand for Year 4.
a. Explain what technique you utilized to forecast your
demand.
b. Explain why you chose this technique over others.
Year 3 Year 1 Year 2 Actual Actual Actual Forecast Forecast Forecast Demand Demand Demand Week 1 52 57 63 55 66 77 Week 2 49 58 68 69 75 65 Week 3 47 50 58 65 80 74 Week 4 60 53 58 55 78 67 57 Week 5 49 57 64 76 77...
Use the accompanying data set on the pulse rates (in beats per minute) of males to...
Use the accompanying data set on the pulse rates (in beats per minute) of males to complete parts (a) and (b) below. LOADING... Click the icon to view the pulse rates of males. a. Find the mean and standard deviation, and verify that the pulse rates have a distribution that is roughly normal. The mean of the pulse rates is 71.871.8 beats per minute. (Round to one decimal place as needed.) The standard deviation of the pulse rates is 12.212.2...
Problem 8.4: Refer to Muscle Mass Problem 1.27. Second-order regression model (8.2) with independent normal error...
Problem 8.4: Refer to Muscle Mass Problem 1.27. Second-order regression model (8.2) with independent normal error terms is expected to be appropriate. A. Fit regression model (8.2). Plot the fitted regression function and the data. Does the quadratic regression function appear to be a good fit here? Find R^2. B. Test whether or not there is regression relation; use α= .05. State the alternatives, decision rule and conclusion. C. Estimate the mean muscle mass for women aged 48...
Problem 4: Variables that may affect Grades The data set contains a random sample of STAT 250 Final Exam Scores out of 80 points. For each individual sampled, the time (in hours per week) that the stu...
Problem 4: Variables that may affect Grades The data set contains a random sample of STAT 250 Final Exam Scores out of 80 points. For each individual sampled, the time (in hours per week) that the student spent participating in a GMU club or sport and working for pay outside of GMU was recorded. Values of 0 indicate the students either does not participate in a club or sport or does not work a job for pay. The goal of...
 Make a graph of the distribution of IQ scores for the
seventh-grade students in table 1.3. Describe the shape, center,
and spread of the distribution as well as any outliers. IQ scores
are usually said to be centered at 100. Is the midpoint for these
students close to 100, clearly above, or clearly below?
TABLE 1.3 Educational Data for 78 Seventh-Grade Self- OBS Gender concept 123 GPA 8.292 4.643 7.470 8.882 7.585 10.760 9.763 9.410 9.167 9.348 8.167 107 046...
Make a graph of the distribution of IQ scores for the
seventh-grade students in table 1.3. Describe the shape, center,
and spread of the distribution as well as any outliers. IQ scores
are usually said to be centered at 100. Is the midpoint for these
students close to 100, clearly above, or clearly below?
TABLE 1.3 Educational Data for 78 Seventh-Grade Self- OBS Gender concept 123 GPA 8.292 4.643 7.470 8.882 7.585 10.760 9.763 9.410 9.167 9.348 8.167 107 046...
 1.40 Describe the IQ scores. Make a graph of the distribution of IQ scores for the seventh-grade students in Table 1.3. Describe the shape, center, and spread of the 26 Chapter 1 Looking at Data-Distributions TABLE 1.3 Educational Data for 78 Seventh-Grade Sltudents Educational Data for 78 Seventh-Grade Students OBS GPA 1O Gender concept I0 Genderconcept 7.940 8.292 4.643 7.470 8.882 7.585 7.650 2.412 6.000 10.760 9.763 003 9410 126 9.167 9.348 127 047 51 8.167 3.647 3.408 3.936 119...
 For determining half-lives of radioactive isotopes, it is important to know what the background radiation is in a given detector over a specific period. The following data were taken in a y -ray detection experiment over 98 ten-second intervals: 58 50 57 58 64 63 54 64 59 41 43 56 60 50 46 59 54 60 59 60 67 52 65 63 55 61 68 58 63 36 42 54 58 54 40 60 64 56 61 51 48...
 1. Forecast demand for Year 4.
a. Explain what technique you utilized to forecast your
demand.
b. Explain why you chose this technique over others.
Year 3 Year 1 Year 2 Actual Actual Actual Forecast Forecast Forecast Demand Demand Demand Week 1 52 57 63 55 66 77 Week 2 49 58 68 69 75 65 Week 3 47 50 58 65 80 74 Week 4 60 53 58 55 78 67 57 Week 5 49 57 64 76 77...
1. Forecast demand for Year 4.
a. Explain what technique you utilized to forecast your
demand.
b. Explain why you chose this technique over others.
Year 3 Year 1 Year 2 Actual Actual Actual Forecast Forecast Forecast Demand Demand Demand Week 1 52 57 63 55 66 77 Week 2 49 58 68 69 75 65 Week 3 47 50 58 65 80 74 Week 4 60 53 58 55 78 67 57 Week 5 49 57 64 76 77...
Most questions answered within 3 hours.
-
Ken believes the average age of men who come to get a haircut at
his barber...
asked 5 minutes ago -
(Ratio Analysis): Last year Co. XYZ had sales of $ 400,000, with
“cost of goods sold”...
asked 14 minutes ago -
can someone please write the balanced chemical
equation for the synthesis of Bromoacetanilide
from;
aniline +...
asked 10 minutes ago -
1. If a corporation purchases land and building and subsequently
tears down the building and uses...
asked 21 minutes ago -
Consider a 23-year bond with 7 percent annual coupon payments.
The market rate (YTM) is 6.4...
asked 24 minutes ago -
a tuba creates a 4th harmonic of frequency 116.5 Hz. what is the
frequency of the...
asked 30 minutes ago -
A coconut mass 2kg falls from a 30m tall tree. The coconut falls
and comes to...
asked 33 minutes ago -
Group Policies
Research GROUP POLICY OBJECTS (GPO'S)
You can start in the Windows Server 2012 eBook...
asked 37 minutes ago -
software engineering
Problems.
Create a use case diagram for class registration for a
university.
Create a...
asked 37 minutes ago -
You are trying to convince your friend who wants to attend
medical school to take BY123...
asked 52 minutes ago -
Subject: C++
I have created a class called QueueOfIntegers in a file called
QueueOfIntegers.h, which is...
asked 52 minutes ago -
calculate the number of molecules of gas in a
container of 2.0 liter at 30 degrees...
asked 1 hour ago