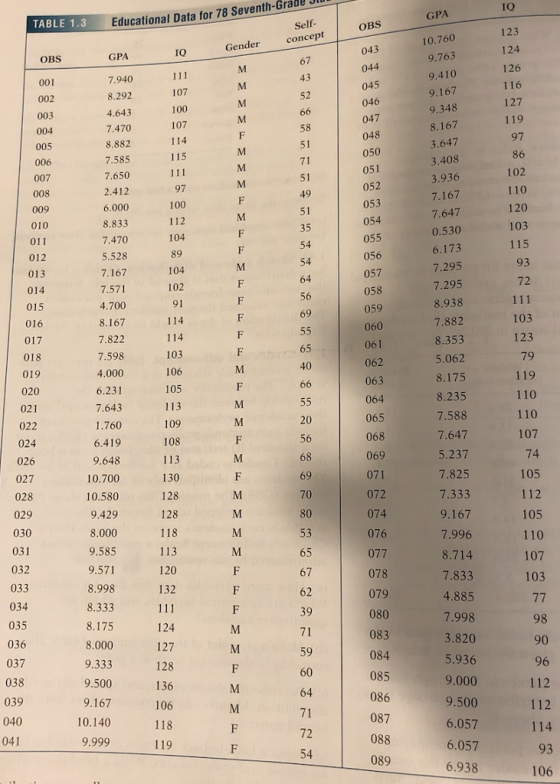
Make a graph of the distribution of IQ scores for the seventh-grade students in table 1.3. Describe the shape, center, and spread of the distribution as well as any outliers. IQ scores are usually said to be centered at 100. Is the midpoint for these students close to 100, clearly above, or clearly below?
Homework Answers
Answer:
Make a graph of the distribution of IQ scores for the seventh-grade students in table 1.3. Describe the shape, center, and spread of the distribution as well as any outliers. IQ scores are usually said to be centered at 100. Is the midpoint for these students close to 100, clearly above, or clearly below?
MINITAB used

The shape is approximately bell shaped. The center is around 105. The range is 72 to 136.
The mid point is clearly above 100.
Descriptive Statistics: IQ
|
Variable |
N |
Mean |
StDev |
Minimum |
Q1 |
Median |
Q3 |
Maximum |
IQR |
|
IQ |
78 |
108.92 |
13.17 |
72.00 |
103.00 |
110.00 |
118.00 |
136.00 |
15.00 |
Add Answer to:
Make a graph of the distribution of IQ scores for the
seventh-grade students in table 1.3....
1.40 Describe the IQ scores. Make a graph of the distribution of IQ scores for the...
 1.40 Describe the IQ scores. Make a graph of the distribution of IQ scores for the seventh-grade students in Table 1.3. Describe the shape, center, and spread of the 26 Chapter 1 Looking at Data-Distributions TABLE 1.3 Educational Data for 78 Seventh-Grade Sltudents Educational Data for 78 Seventh-Grade Students OBS GPA 1O Gender concept I0 Genderconcept 7.940 8.292 4.643 7.470 8.882 7.585 7.650 2.412 6.000 10.760 9.763 003 9410 126 9.167 9.348 127 047 51 8.167 3.647 3.408 3.936 119...
The data from data349.dat contains information on 78 seventh-grade students. We want to know how well each of IQ score a...
The data from data349.dat contains information on 78 seventh-grade students. We want to know how well each of IQ score and self-concept score predicts GPA using least-squares regression. We also want to know which of these explanatory variables predicts GPA better. Give numerical measures that answer these questions. (Round your answers to three decimal places.) (Regressor: IQ) R 2 (Regressor: Self-Concept) R 2 Which variable is the better predictor? IQ Self Concept obs gpa iq gender concept 1 7.94 112 ...
The data from data421.dat contains information on 78 seventh-grade students. We want to know how well...
The data from data421.dat contains information on 78 seventh-grade students. We want to know how well each of IQ score and self-concept score predicts GPA using least-squares regression. We also want to know which of these explanatory variables predicts GPA better. Give numerical measures that answer these questions. (Round your answers to three decimal places.) find:(Regressor: IQ) R 2 find: (Regressor: Self-Concept) R 2 obs gpa iq gender concept 1 7.94 103 2 54 2 8.292 111 2 73 3...
The data from data95.dat contains information on 78 seventh-grade students. We want to know how well each of IQ score and self-concept score predicts GPA using least-squares regression. We also want t...
The data from data95.dat contains information on 78 seventh-grade students. We want to know how well each of IQ score and self-concept score predicts GPA using least-squares regression. We also want to know which of these explanatory variables predicts GPA better. Give numerical measures that answer these questions. (Round your answers to three decimal places.) (Regressor: IQ) R 2 : (Regressor: Self-Concept) R 2 : Which variable is the better predictor? IQSelf Concept obs gpa iq gender concept 1 7.94...
Gender Selfconce ID GPA 7.940111 8.292107 4.643 100 7.470107 67 2 4 3 52 8.882 114 7.585 115 7.650111 58 71 51 2...
 Gender Selfconce ID GPA 7.940111 8.292107 4.643 100 7.470107 67 2 4 3 52 8.882 114 7.585 115 7.650111 58 71 51 2.412 97 6.000 100 8.833 112 4 9 51 7.470 104 35 5.528 89 54 13 7.167104 54 64 56 69 7.571 102 4.700 91 8.167114 15 17 7.822 114 65 7.598 103 4.000 106 19 40 6.231 105 21 7.643 113 1.760 109 20 24 6.419 108 56 68 69 9.648 113 2 27 10.700 130 28...
 1.40 Describe the IQ scores. Make a graph of the distribution of IQ scores for the seventh-grade students in Table 1.3. Describe the shape, center, and spread of the 26 Chapter 1 Looking at Data-Distributions TABLE 1.3 Educational Data for 78 Seventh-Grade Sltudents Educational Data for 78 Seventh-Grade Students OBS GPA 1O Gender concept I0 Genderconcept 7.940 8.292 4.643 7.470 8.882 7.585 7.650 2.412 6.000 10.760 9.763 003 9410 126 9.167 9.348 127 047 51 8.167 3.647 3.408 3.936 119...
 Gender Selfconce ID GPA 7.940111 8.292107 4.643 100 7.470107 67 2 4 3 52 8.882 114 7.585 115 7.650111 58 71 51 2.412 97 6.000 100 8.833 112 4 9 51 7.470 104 35 5.528 89 54 13 7.167104 54 64 56 69 7.571 102 4.700 91 8.167114 15 17 7.822 114 65 7.598 103 4.000 106 19 40 6.231 105 21 7.643 113 1.760 109 20 24 6.419 108 56 68 69 9.648 113 2 27 10.700 130 28...
Most questions answered within 3 hours.
-
A) Suppose U=X∙Y3. Find X* and Y*.
B) Suppose U=X3∙Y. Find X* and Y*.
C) Suppose...
asked 23 minutes ago -
The only quantities of good 1 that Barbara can buy are 1 unit or
zero units....
asked 13 minutes ago -
c. Node Admittance matrix and its use in different calculations
of power transmission system. Display the...
asked 21 minutes ago -
6. Suppose that the Bank of Canada conducts an open market
purchase of $2000 from a...
asked 15 minutes ago -
Try to get the code down to less than 40 lines. (PYTHON)
import random
fave_number =...
asked 20 minutes ago -
A Chi-square distribution with 14 degrees of freedom is a
correct model for
Question 8 options:...
asked 18 minutes ago -
2.
Regression analysis was applied between sales (in $1,000) and
advertising (in $100), and the following...
asked 29 minutes ago -
I just took a final for chemistry 2. There were alot of
questions on cell potential....
asked 1 hour ago -
A spherical weather balloon is filled with hydrogen until its
radius is 2.30 m. Its total...
asked 26 minutes ago -
Calculate the entropy change for the hypothetical process in
which 0.5 g of ice at 0°C...
asked 48 minutes ago -
When an airplane is flying 200 mph at 5000-ft altitude in a
standard atmosphere, the air...
asked 36 minutes ago -
Consider the economy of Freeland, whose overall actual price
index and actual output are P and...
asked 49 minutes ago