
Homework Answers

Add Answer to:
8. Two independent random samples drawn from normal distributions have equal variances and means pli and...
8. Two independent random samples drawn from normal distributions have equal variances and means and p2....
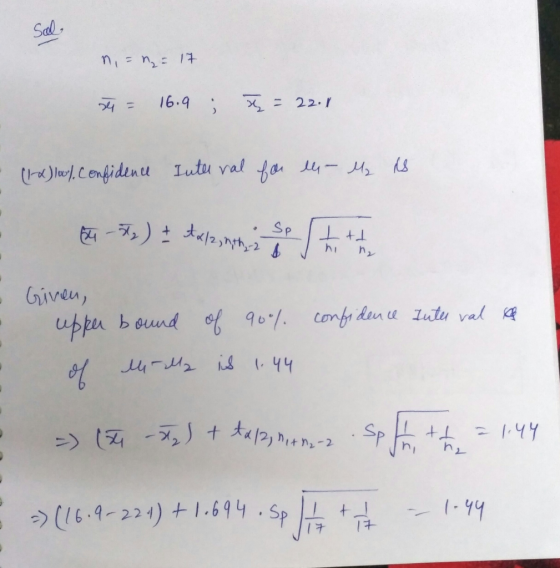
 8. Two independent random samples drawn from normal distributions have equal variances and means and p2. You are given The sample mean from the first sample is 16.9 The sample mean from the second sample is 22.1 The number of observations from both samples combined is 17 The upper bound of the 90% confidence interval for -2 is 1.44 Let tbe the critical value of a t random variable with v degrees of freedom. The foll owing table lists values...
you select two independent random samples from populations with means u1 and u2. suppose the sample...
you select two independent random samples from populations with means u1 and u2. suppose the sample mean for population 1 is 25 and σ1=3 and the sample mean for population is 20 and σ2=4. the 95% confidence interval for u1-u2 is (4.02,5.98). what common sample size, n, was used to obtain this interval?
Independent random samples selected from two normal populations produced the sample means and standard deviations shown...
Independent random samples selected from two normal populations produced the sample means and standard deviations shown to the right. a) Assuming equal variances, conduct the test Ho: (u1-u2)=0 against Ha: (u1-u2)=/=0 using a=0.05 b) Find and interpret the 95% confidence interval for (u1-u2) Sample1: n1=17, x1=5.9, s1=3.8 Sample2: n2=10, x1=7.3, s2=4.8
Consider the following data for two independent random samples taken from two normal populations with equal...
Consider the following data for two independent random samples taken from two normal populations with equal variances. Find the 80% confidence interval for u1 and u2. Sample 1: 7, 4, 10, 10, 6, 11 Sample 2: 13, 16, 10, 9, 13, 14 What is the left endpoint and right endpoint? Please explain in detail.
Independent random samples were selected from two quantitative populations, with sample sizes, means, and variances given...
Independent random samples were selected from two quantitative populations, with sample sizes, means, and variances given below. Population 1 2 Sample Size 39 44 Sample Mean 9.3 7.3 Sample Variance 8.5 14.82 Construct a 90% confidence interval for the difference in the population means. (Use μ1 − μ2. Round your answers to two decimal places.) __________ to ____________ Construct a 99% confidence interval for the difference in the population means. (Round your answers to two decimal places.) __________ to _____________
In order to compare the means of two populations, independent random samples of 385 observations are...
In order to compare the means of two populations, independent random samples of 385 observations are selected from each population, with the results found in the table to the right. Complete parts a through e. Sample 1 Sample 2 X1 = 5,337 X2 = 5,298 s1 = 157 s2 = 191 a. use a 95% confidence interval to estimate the difference between the population means (u1 - u2). Interpret the confidence interval. b. test the null hypothesis H0: (u1 - u2)...
Consider the folloing data for two independent random samples taken from two normal populations with equal...
Consider the folloing data for two independent random samples taken from two normal populations with equal variances. find the 80% confidence interval for µ1 - µ2. sample 1: 12,8,11,6,13,7 sample 2: 13,16,10,9,13,14 what is the left endpoint and right endpoint?
Consider the following data for two independent random samples taken from two normal populations with equal...
Consider the following data for two independent random samples taken from two normal populations with equal variances. Find the 80% confidence interval for µ1 - µ2. sample 1: 11, 5, 12, 9, 6, 8 sample 2: 11, 9, 8, 13, 14, 11 what are the left and right endpoints?
Evaluation: Estimate the Difference of the Means of Two Normal Random Variables Each numerical entry must...
 Evaluation: Estimate the Difference of the Means of Two Normal Random Variables Each numerical entry must be accurate to the nearest 0.001 . Given a sample of size 200 of the normal random variable Z_5.1,3.8 , and a sample of size 250 of the normal random variable 26,5.8 , let X1 and X, denote the averages of the two samples. a. The difference of the averages Xi - X2 is a normal random variable with mean = and standard deviation...
Consider the following results for two samples randomly taken from two normal populations with equal variances....
Consider the following results for two samples randomly taken from two normal populations with equal variances. Sample I Sample II Sample Size 28 35 Sample Mean 48 44 Population Standard Deviation 9 10 a. Develop a 95% confidence interval for the difference between the two population means. b. Is there conclusive evidence that one population has a larger mean? Explain.
 8. Two independent random samples drawn from normal distributions have equal variances and means and p2. You are given The sample mean from the first sample is 16.9 The sample mean from the second sample is 22.1 The number of observations from both samples combined is 17 The upper bound of the 90% confidence interval for -2 is 1.44 Let tbe the critical value of a t random variable with v degrees of freedom. The foll owing table lists values...
 Evaluation: Estimate the Difference of the Means of Two Normal Random Variables Each numerical entry must be accurate to the nearest 0.001 . Given a sample of size 200 of the normal random variable Z_5.1,3.8 , and a sample of size 250 of the normal random variable 26,5.8 , let X1 and X, denote the averages of the two samples. a. The difference of the averages Xi - X2 is a normal random variable with mean = and standard deviation...
Most questions answered within 3 hours.
-
Please Help ASAP.
1Consider the below code which iterates over a linked
list of n nodes...
asked 9 minutes ago -
Determine the air to fuel ratio of:
Canadian natural gas, with 93.9% methane, 4.2% ethane, 0.3%...
asked 9 minutes ago -
A manufacturer of power tools claims that the average amount of
time required to assemble their...
asked 12 minutes ago -
"electron-withdrawing substituents on carbon encourage back
donation", then on the next page he says that "greater...
asked 23 minutes ago -
On December 31, 2016, the shareholders’ equity section of the
balance sheet of R & L...
asked 31 minutes ago -
16.7
At t=0s a small "upward" (positive y) pulse centered at x = 5.0
m is...
asked 45 minutes ago -
Twitter Users and News: A poll conducted in 2013 found that 52%
of U.S. adult Twitter...
asked 1 hour ago -
How
would I know whether a given amino acid has an ionizable group or
not? please...
asked 1 hour ago -
True or false?
True False The function of the enzyme acyl CoA
synthetase is the ATP-dependent coupling...
asked 1 hour ago -
Nadia Corporation adjusts its debt so that its interest coverage
(EBIT/Interest) remains constant at 3. Nadia’s...
asked 1 hour ago -
In a clinical trial, 20 out of 600 patients taking a
prescription drug complained of flulike...
asked 1 hour ago -
7. How many types of nuclear processes can produce energy? 8.
How many types of radioactive...
asked 1 hour ago