The mean height of a random sample of 47 students who take part in athletic activities...
The mean height of a random sample of 47 students who take part in athletic activities at NRDC is 175cm with a standard deviation of 5cm while a random sample of 132 students who showed no interest in athletics had a mean of 170cm and a standard deviation of 7cm. (a) Construct a 99% confidence interval for the difference in the mean heights of the two groups of students. (b) Are students who take part in athletic activities taller? Test at the 1% level of significance
Homework Answers
(a)
Confidence interval for the difference in means is given as:
SE is given by by :
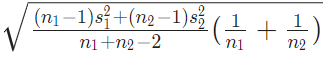

SE = 0.9504
99% confidence interval for the difference in the mean heights of the two groups of students :
b)
We conduct T-test for two Means :


 Hence, we conclude that
Students who take
part in athletic activities are actually taller at
1% level of significance.
Hence, we conclude that
Students who take
part in athletic activities are actually taller at
1% level of significance.
Add Answer to:
The mean height of a random sample of 47 students who take part
in athletic activities...
The mean height of a random sample of 47 students who take part in athletic activities...
The mean height of a random sample of 47 students who take part in athletic activities at a College is 175cm with a standard deviation of 5cm while a random sample of 132 students who showed no interest in athletics had a mean of 170cm and a standard deviation of 7cm. (a) Construct a 99% confidence interval for the difference in the mean heights of the two groups of students. (b) Are students who take part in athletic activities taller?...
A random sample of 40 students at a university finds that these students take a mean...
 A random sample of 40 students at a university finds that these students take a mean of 14.7 credit hours per quarter with a standard deviation of 1.9 credit hours. The 95% confidence interval for the mean credit hours per quarter will be O A. narrower than the 99% confidence interval OB. wider than the 99% confidence interval O c. the same width as the 90% confidence interval OD. narrower than the 90% confidence interval O E. none of the...
2. A simple random sample of 15 college students showed a mean credit score of 655 and standard deviation 20. Const...
 2. A simple random sample of 15 college students showed a mean credit score of 655 and standard deviation 20. Construct the 99% confidence interval estimate of the mean credit score for all college students. a. State the critical value. b. Compute the margin of error. c. State the confidence interval.
Please show ALL steps for each part Suppose that, in a certain population, heights of males...
 Please show ALL steps for each part
Suppose that, in a certain population, heights of males are normally distributed with mean M1 = 178cm and standard deviation 01 = 4cm while heights of females are normally dis- tributed with M2 = 170cm and 01 = 3cm. Now suppose that a random sample of 25 males and 25 females are selected from the population. a) What is the probability that the average height of the males is greater than 180cm? b)...
Please show ALL steps for each part
Suppose that, in a certain population, heights of males are normally distributed with mean M1 = 178cm and standard deviation 01 = 4cm while heights of females are normally dis- tributed with M2 = 170cm and 01 = 3cm. Now suppose that a random sample of 25 males and 25 females are selected from the population. a) What is the probability that the average height of the males is greater than 180cm? b)...
a simple random sample of 26 college students showed a mean credit score of 575 and...
a simple random sample of 26 college students showed a mean credit score of 575 and a standard deviation 10. construct the 90% confidence interval estimate of the mean credit score for all college students a. state the critical value b. compute the margin of error c. state the confidence interval
A random sample of 16 men have a mean height of 67.5 inches and a standard...
A random sample of 16 men have a mean height of 67.5 inches and a standard deviation of 1.8 inches. Construct a 99% confidence interval for the population standard deviation,σ.
Historically, students who take OSCM 5510 have a mean score of 85 and a standard deviation...
Historically, students who take OSCM 5510 have a mean score of 85 and a standard deviation of 8. A random sample of 25 OSCM 5510 students is selected. The expected value and the standard deviation of their average score are a. 25 and 1.6 b. 85 and 1.6 c. 25 and 8 d. 85 and 8
A random sample of 47 cows was selected to investigate the claim that the mean weekly...
 A random sample of 47 cows was selected to investigate the claim that the mean weekly milk yield for cows is greater than 120 kilograms. The sample mean weekly milk yield is 128.7 and the sample standard deviation is 24.9. Let u be the population mean weekly milk yield for cows. (give answer to two places past decimal) 1. Construct a 90% lower confidence bound for u. Lower Bound: Submit Answer Tries 0/99 2. Perform a hypothesis test to see...
s. A random sample of 5 athletic students was selected, them. The sample data is listed as foows 41↓49-452446a- normal population, construct a 95% confidence interval for the then the resting hea...
 s. A random sample of 5 athletic students was selected, them. The sample data is listed as foows 41↓49-452446a- normal population, construct a 95% confidence interval for the then the resting heart rate (unit beats per ach ore S (a) Assuming all athletic st e students. Your final result is Keep 3 decimals) (20 points) Based on this sample, a new study is designed to construct a 95% confidence interval for the averag (10 p resting heart rate for all...
Need help with these problems A researcher collected a simple random sample of the cents portions...
 Need help with these problems
A researcher collected a simple random sample of the cents portions from 100 checks and from 100 credit card charges. The cents portions of the checks have a mean of 23.8 cents and a standard deviation of 32.0 cents. The cents portions of the credit charges have a mean of 47.6 cents and a standard deviation of 33.5 cents. Construct a 95% confidence interval for the mean difference between the cent portions of credit cards...
Need help with these problems
A researcher collected a simple random sample of the cents portions from 100 checks and from 100 credit card charges. The cents portions of the checks have a mean of 23.8 cents and a standard deviation of 32.0 cents. The cents portions of the credit charges have a mean of 47.6 cents and a standard deviation of 33.5 cents. Construct a 95% confidence interval for the mean difference between the cent portions of credit cards...
 A random sample of 40 students at a university finds that these students take a mean of 14.7 credit hours per quarter with a standard deviation of 1.9 credit hours. The 95% confidence interval for the mean credit hours per quarter will be O A. narrower than the 99% confidence interval OB. wider than the 99% confidence interval O c. the same width as the 90% confidence interval OD. narrower than the 90% confidence interval O E. none of the...
 2. A simple random sample of 15 college students showed a mean credit score of 655 and standard deviation 20. Construct the 99% confidence interval estimate of the mean credit score for all college students. a. State the critical value. b. Compute the margin of error. c. State the confidence interval.
 Please show ALL steps for each part
Suppose that, in a certain population, heights of males are normally distributed with mean M1 = 178cm and standard deviation 01 = 4cm while heights of females are normally dis- tributed with M2 = 170cm and 01 = 3cm. Now suppose that a random sample of 25 males and 25 females are selected from the population. a) What is the probability that the average height of the males is greater than 180cm? b)...
Please show ALL steps for each part
Suppose that, in a certain population, heights of males are normally distributed with mean M1 = 178cm and standard deviation 01 = 4cm while heights of females are normally dis- tributed with M2 = 170cm and 01 = 3cm. Now suppose that a random sample of 25 males and 25 females are selected from the population. a) What is the probability that the average height of the males is greater than 180cm? b)...
 A random sample of 47 cows was selected to investigate the claim that the mean weekly milk yield for cows is greater than 120 kilograms. The sample mean weekly milk yield is 128.7 and the sample standard deviation is 24.9. Let u be the population mean weekly milk yield for cows. (give answer to two places past decimal) 1. Construct a 90% lower confidence bound for u. Lower Bound: Submit Answer Tries 0/99 2. Perform a hypothesis test to see...
 s. A random sample of 5 athletic students was selected, them. The sample data is listed as foows 41↓49-452446a- normal population, construct a 95% confidence interval for the then the resting heart rate (unit beats per ach ore S (a) Assuming all athletic st e students. Your final result is Keep 3 decimals) (20 points) Based on this sample, a new study is designed to construct a 95% confidence interval for the averag (10 p resting heart rate for all...
 Need help with these problems
A researcher collected a simple random sample of the cents portions from 100 checks and from 100 credit card charges. The cents portions of the checks have a mean of 23.8 cents and a standard deviation of 32.0 cents. The cents portions of the credit charges have a mean of 47.6 cents and a standard deviation of 33.5 cents. Construct a 95% confidence interval for the mean difference between the cent portions of credit cards...
Need help with these problems
A researcher collected a simple random sample of the cents portions from 100 checks and from 100 credit card charges. The cents portions of the checks have a mean of 23.8 cents and a standard deviation of 32.0 cents. The cents portions of the credit charges have a mean of 47.6 cents and a standard deviation of 33.5 cents. Construct a 95% confidence interval for the mean difference between the cent portions of credit cards...
Most questions answered within 3 hours.
-
Fiscal policy is the deliberate manipulation of taxes and
government spending to alter GDP, employment, inflation...
asked 26 minutes ago -
evaluating an expression using only one digit and + and - as
operators ....3+5-1+7-5+8
-----------------------
stack...
asked 27 minutes ago -
Two concentric current loops lie in the same plane. The smaller
loop has a radius of...
asked 54 minutes ago -
1)Which of the following is an
important difference between qualified and nonqualified retirement
plans?
a. Qualified...
asked 1 hour ago -
What's the streaming business's problem on the
horizon?
asked 2 hours ago -
I need help with writing the conclusion for this online lab
report
Abstract
By testing the...
asked 2 hours ago -
For the reaction 1N2+3H2-----> 2NH3, would the reaction rate
trend be: delta[NH3]/ delta t = -2...
asked 2 hours ago -
Within your current/past organization, identify a problem/issue
and format a design to address same. You may...
asked 2 hours ago -
A sock stuck to the side of a clothes-dryer barrel has a
centripetal acceleration of 24...
asked 3 hours ago -
A perfect gas undergoes an isentropic process such that its
volume doubles. If the ratio of...
asked 3 hours ago -
list the elements in groups 3A to 6A in the same order as in the
periodic...
asked 4 hours ago -
Estimating effect size. Peng and Chen (2014)
evaluated effect size estimates for various tests. In their...
asked 4 hours ago