
Homework Answers


Add Answer to:
can you please write out how to get the t-value/p-value based
of this output? i included...
can you please help with writing up the calculations with formulas for one-way ANOVA for a null hypothesis of... th...
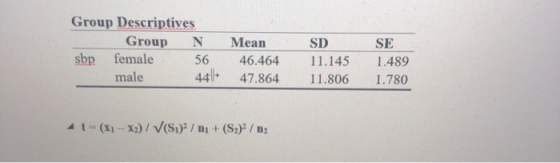
 can you please help with writing up the calculations with formulas for one-way ANOVA for a null hypothesis of... the output from JASP is provided with ANOVA output and descriptive output Ho: 41 = u2 H: U17 Descriptives - sbp sex Mean SD female 46.464 11.145 male 47.864 11.806 44 Mean F ANOVA - sbp Sum of Cases df Squares sex 48.250 1.000 Residual 12825.110 98.000 P. Square 48.250 0.369 0.545 130.868
can you please help with writing up the calculations with formulas for one- way ANOVA for...
can you please help with writing up the calculations with formulas for one- way ANOVA for a null hypothesis of... the output from JASP is provided with ANOVA output and descriptive output Ho : μ1 = μ2 Ha : μ1 ≠ Descriptives - sbp sex Mean SD N female 46.464 11.145 56 male 47.864 11.806 44 ANOVA - sbp Cases Sum of Squares df Mean Square F p Note. Type III Sum of Squares sex 48.250 1.000 48.250 0.369...
Lab Worksheet: independent samples t-test . Identify the proper variables and hypotheses for the following research...
 Lab Worksheet: independent samples t-test . Identify the proper variables and hypotheses for the following research question: Is there a difference in the number of digits recalled between auditory and visual presentation of the digit span task? 2 point:s a. What is the IV and its corresponding levels conditions? i. Condition: 1. Auditory 2. Visual b. What is the DV as operationally defined (measured)? i. Digits Recalled ii. Time To Complete State the null hypothesis: Ho: A d. State the...
could you please show your work on how you get the value of (P) please? thats...
 could you please show your work on how you get the value of (P)
please? thats where im having a lot of trouble
3. A consumer group claims that the mean minimum time it takes for a sedan to travel a quarter mile is greater than 146 seconds. A random sample of 24 sedans has a mean minimum time to travel a quarter mile of 15.2 seconds and a standa deviation of 2.11 seconds. At = 0.10 is there enough...
could you please show your work on how you get the value of (P)
please? thats where im having a lot of trouble
3. A consumer group claims that the mean minimum time it takes for a sedan to travel a quarter mile is greater than 146 seconds. A random sample of 24 sedans has a mean minimum time to travel a quarter mile of 15.2 seconds and a standa deviation of 2.11 seconds. At = 0.10 is there enough...
You will then computea statistic from the raw date. You can find the p value associated...
 You will then computea statistic from the raw date. You can find the p value associated with this statistic in the same manner by locating where would le within the row that corresponds to the appropriate degrees of freedom. If this value is below the a value, you will reject the nutrypothesis in favor of an alternative hypothesis, which states that the means are significantly different DATA ANALYSIS AND HYPOTHESIS TESTING Art wure of a well-designed experiment la replication, which...
hi how do you get the t value in the cal ti83 Test the indicated claim...
 hi
how do you get the t value in the cal ti83
Test the indicated claim about the means of two populations. Assume that the two samples are independent and that they have been randomly selected. 3) Two types of flares are tested for their burning times (in minutes) and sample results are 3 given below. Brand X n35 x=19.4 $ 1.4 Brand Y n = 40 x 15.1 S0.8 Refer to the sample data to test the claim that...
hi
how do you get the t value in the cal ti83
Test the indicated claim about the means of two populations. Assume that the two samples are independent and that they have been randomly selected. 3) Two types of flares are tested for their burning times (in minutes) and sample results are 3 given below. Brand X n35 x=19.4 $ 1.4 Brand Y n = 40 x 15.1 S0.8 Refer to the sample data to test the claim that...
Need help figuring out how the P value was obtained, can I please get a breakdown...
 Need help figuring out how the P value was obtained, can I
please get a breakdown of the process?
Population1 Population 2 Assume that both populations are normally distributed (a) Test whether ?1 12 at the ?:0.05 level of significance for the given sample data. (b) Construct a 95% confidence interval about 1- 16 5.6 (a) Test whether ?| 2 at the ? 0.05 level of significance for the given sample data. Determine the null and alternative hypothesis for this...
Need help figuring out how the P value was obtained, can I
please get a breakdown of the process?
Population1 Population 2 Assume that both populations are normally distributed (a) Test whether ?1 12 at the ?:0.05 level of significance for the given sample data. (b) Construct a 95% confidence interval about 1- 16 5.6 (a) Test whether ?| 2 at the ? 0.05 level of significance for the given sample data. Determine the null and alternative hypothesis for this...
And can you show me how to calculate the P-value please Hw Score: 40%, 10of25pes 11.3.8-T...
 And can you show me how to calculate the P-value please
Hw Score: 40%, 10of25pes 11.3.8-T H: A white candidale is more likely to pass the test than a minority candidale
And can you show me how to calculate the P-value please
Hw Score: 40%, 10of25pes 11.3.8-T H: A white candidale is more likely to pass the test than a minority candidale
can i just get the answers please, thank you! Data Participant 1 Dissimilar Distractors 78 2...
 can i just get the answers please, thank you!
Data Participant 1 Dissimilar Distractors 78 2 71 Similar Distractors 115 101 98 179 107 3 89 14 56 96 5 Which statistical test would you select: Ho: H1: UDO Regression equation M1 - M2 = 0 UD = 0 Single sample t-test u1 - 2 #0 Dependent samples t-test UM = 0 P7.00 Pearson correlation 1 - 2 = 0 Independent samples t-test M1 - M270 UM = 0 Single...
can i just get the answers please, thank you!
Data Participant 1 Dissimilar Distractors 78 2 71 Similar Distractors 115 101 98 179 107 3 89 14 56 96 5 Which statistical test would you select: Ho: H1: UDO Regression equation M1 - M2 = 0 UD = 0 Single sample t-test u1 - 2 #0 Dependent samples t-test UM = 0 P7.00 Pearson correlation 1 - 2 = 0 Independent samples t-test M1 - M270 UM = 0 Single...
How do you solve these questions (i.e. can someone show their work please)? The answers are...
 How do you solve these questions (i.e. can someone show their
work please)? The answers are already shown here, but I do not how
the solutions are arrived at. Thanks so much.
17. Eight marksmen, labeled A, B,...,H, shot at targets with two types of rifle. Their scores were as in the table below: Marksman LA B C D E F G H sample mean sample SD Rifle Type 1 93 99 90 87 85 94 88 91 90.875 4.45...
How do you solve these questions (i.e. can someone show their
work please)? The answers are already shown here, but I do not how
the solutions are arrived at. Thanks so much.
17. Eight marksmen, labeled A, B,...,H, shot at targets with two types of rifle. Their scores were as in the table below: Marksman LA B C D E F G H sample mean sample SD Rifle Type 1 93 99 90 87 85 94 88 91 90.875 4.45...
 can you please help with writing up the calculations with formulas for one-way ANOVA for a null hypothesis of... the output from JASP is provided with ANOVA output and descriptive output Ho: 41 = u2 H: U17 Descriptives - sbp sex Mean SD female 46.464 11.145 male 47.864 11.806 44 Mean F ANOVA - sbp Sum of Cases df Squares sex 48.250 1.000 Residual 12825.110 98.000 P. Square 48.250 0.369 0.545 130.868
 Lab Worksheet: independent samples t-test . Identify the proper variables and hypotheses for the following research question: Is there a difference in the number of digits recalled between auditory and visual presentation of the digit span task? 2 point:s a. What is the IV and its corresponding levels conditions? i. Condition: 1. Auditory 2. Visual b. What is the DV as operationally defined (measured)? i. Digits Recalled ii. Time To Complete State the null hypothesis: Ho: A d. State the...
 could you please show your work on how you get the value of (P)
please? thats where im having a lot of trouble
3. A consumer group claims that the mean minimum time it takes for a sedan to travel a quarter mile is greater than 146 seconds. A random sample of 24 sedans has a mean minimum time to travel a quarter mile of 15.2 seconds and a standa deviation of 2.11 seconds. At = 0.10 is there enough...
could you please show your work on how you get the value of (P)
please? thats where im having a lot of trouble
3. A consumer group claims that the mean minimum time it takes for a sedan to travel a quarter mile is greater than 146 seconds. A random sample of 24 sedans has a mean minimum time to travel a quarter mile of 15.2 seconds and a standa deviation of 2.11 seconds. At = 0.10 is there enough...
 You will then computea statistic from the raw date. You can find the p value associated with this statistic in the same manner by locating where would le within the row that corresponds to the appropriate degrees of freedom. If this value is below the a value, you will reject the nutrypothesis in favor of an alternative hypothesis, which states that the means are significantly different DATA ANALYSIS AND HYPOTHESIS TESTING Art wure of a well-designed experiment la replication, which...
 hi
how do you get the t value in the cal ti83
Test the indicated claim about the means of two populations. Assume that the two samples are independent and that they have been randomly selected. 3) Two types of flares are tested for their burning times (in minutes) and sample results are 3 given below. Brand X n35 x=19.4 $ 1.4 Brand Y n = 40 x 15.1 S0.8 Refer to the sample data to test the claim that...
hi
how do you get the t value in the cal ti83
Test the indicated claim about the means of two populations. Assume that the two samples are independent and that they have been randomly selected. 3) Two types of flares are tested for their burning times (in minutes) and sample results are 3 given below. Brand X n35 x=19.4 $ 1.4 Brand Y n = 40 x 15.1 S0.8 Refer to the sample data to test the claim that...
 Need help figuring out how the P value was obtained, can I
please get a breakdown of the process?
Population1 Population 2 Assume that both populations are normally distributed (a) Test whether ?1 12 at the ?:0.05 level of significance for the given sample data. (b) Construct a 95% confidence interval about 1- 16 5.6 (a) Test whether ?| 2 at the ? 0.05 level of significance for the given sample data. Determine the null and alternative hypothesis for this...
Need help figuring out how the P value was obtained, can I
please get a breakdown of the process?
Population1 Population 2 Assume that both populations are normally distributed (a) Test whether ?1 12 at the ?:0.05 level of significance for the given sample data. (b) Construct a 95% confidence interval about 1- 16 5.6 (a) Test whether ?| 2 at the ? 0.05 level of significance for the given sample data. Determine the null and alternative hypothesis for this...
 And can you show me how to calculate the P-value please
Hw Score: 40%, 10of25pes 11.3.8-T H: A white candidale is more likely to pass the test than a minority candidale
And can you show me how to calculate the P-value please
Hw Score: 40%, 10of25pes 11.3.8-T H: A white candidale is more likely to pass the test than a minority candidale
 can i just get the answers please, thank you!
Data Participant 1 Dissimilar Distractors 78 2 71 Similar Distractors 115 101 98 179 107 3 89 14 56 96 5 Which statistical test would you select: Ho: H1: UDO Regression equation M1 - M2 = 0 UD = 0 Single sample t-test u1 - 2 #0 Dependent samples t-test UM = 0 P7.00 Pearson correlation 1 - 2 = 0 Independent samples t-test M1 - M270 UM = 0 Single...
can i just get the answers please, thank you!
Data Participant 1 Dissimilar Distractors 78 2 71 Similar Distractors 115 101 98 179 107 3 89 14 56 96 5 Which statistical test would you select: Ho: H1: UDO Regression equation M1 - M2 = 0 UD = 0 Single sample t-test u1 - 2 #0 Dependent samples t-test UM = 0 P7.00 Pearson correlation 1 - 2 = 0 Independent samples t-test M1 - M270 UM = 0 Single...
 How do you solve these questions (i.e. can someone show their
work please)? The answers are already shown here, but I do not how
the solutions are arrived at. Thanks so much.
17. Eight marksmen, labeled A, B,...,H, shot at targets with two types of rifle. Their scores were as in the table below: Marksman LA B C D E F G H sample mean sample SD Rifle Type 1 93 99 90 87 85 94 88 91 90.875 4.45...
How do you solve these questions (i.e. can someone show their
work please)? The answers are already shown here, but I do not how
the solutions are arrived at. Thanks so much.
17. Eight marksmen, labeled A, B,...,H, shot at targets with two types of rifle. Their scores were as in the table below: Marksman LA B C D E F G H sample mean sample SD Rifle Type 1 93 99 90 87 85 94 88 91 90.875 4.45...
Most questions answered within 3 hours.
-
An MNE is this kind of industry when competition in one country
is essentially independent of...
asked 6 minutes ago -
. For this set of questions, determine what
proportion of a normal distribution is located betweeneach...
asked 41 minutes ago -
A college student is employed as a door-to-door newspaper
salesman. Historical data suggests that the student...
asked 1 hour ago -
MATLAB HW 11 problem using Switch Case and Input commands
Write a script file that calculates...
asked 1 hour ago -
Considering gravitational time dilation, calculate the time that
passes in Earth’s surface while 1 hour passes...
asked 2 hours ago -
Minitab Problem: Take the Lake Hume June rainfall data and find
use the processes outlined in...
asked 2 hours ago -
X Company is trying to decide whether to continue using old
equipment to make Product A...
asked 2 hours ago -
IN PYTHON ONLY !! Program 2: Re-work
program #5 (WeeklyHours) from the previous assignment such that...
asked 3 hours ago -
The average length of time between arrivals at a turnpike
toll-booth is 26 seconds. What is...
asked 5 hours ago -
(a) A piston at 6.1 atm contains a gas that occupies a volume of
3.5 L....
asked 6 hours ago -
Please answer true or false. Words
cannot be changed or added in to make it true...
asked 6 hours ago -
An empty test tube weighs 15.923 grams. Then,
MgCl2•6H2O is added into the test tube. After...
asked 6 hours ago