


 I just wanted to have someone check if this
is correct, also the last picture of the table is what I tried to
plug into the graph but the system is skipping over the numbers I
need to plug in when I put my mouse over it so I'm afraid it may be
incorrect. pls help, thank you!
I just wanted to have someone check if this
is correct, also the last picture of the table is what I tried to
plug into the graph but the system is skipping over the numbers I
need to plug in when I put my mouse over it so I'm afraid it may be
incorrect. pls help, thank you!
Homework Answers
The firm set P=MC to find the quantity and it does not produce when the price is below its minimum AVC
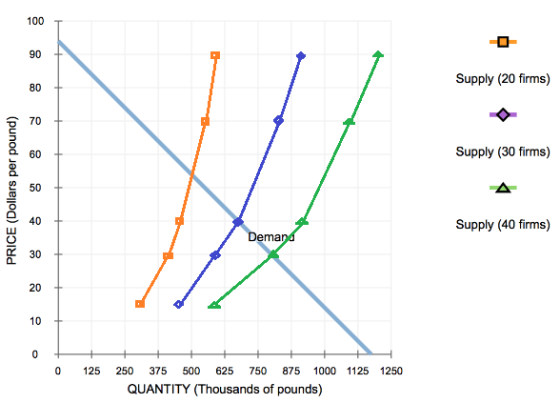
| P | QS-1 FIRM | QS-20 FIRMS | 30 FIRMS | 40 FIRMS |
| 10 | 0 | 0 | 0 | 0 |
| 15 | 15000 | 300000 | 450000 | 600000 |
| 30 | 20000 | 400000 | 600000 | 800000 |
| 40 | 22500 | 450000 | 675000 | 900000 |
| 70 | 27500 | 550000 | 825000 | 1100000 |
| 90 | 30000 | 600000 | 900000 | 1200000 |
Blanks-
1) 40
2) positive profits
3) enter
4) zero
5) 30
6) 40
The statement is True
Add Answer to:
I just wanted to have someone check if this
is correct, also the last picture of...
5. Short-run supply and long-run equilibrium Consider the competitive market for copper. Assume that, regardless of...
 5. Short-run supply and long-run equilibrium Consider the competitive market for copper. Assume that, regardless of how many firms are in the industry, every firm in the industry is identical and faces the marginal cost (MC), average total cost (ATC), and average variable cost (AVC) curves shown on the following graph. COSTS (Dollars per pound) AVC MC O 0 3 27 30 6 9 12 15 18 21 24 QUANTITY (Thousands of pounds) The following diagram shows the market demand...
Consider the competitive market for copper. Assume that, regardless of how many firms are in the...
 Consider the competitive market for copper. Assume that, regardless of how many firms are in the industry, every firm in the industry is identical and faces the marginal cost (MC), average total cost (ATC), and average variable cost (AVC) curves shown on the following graph 80 72 64 56 48 ATC 40 32 24 AVC 16 МС П 8 0 0 4 8 12 16 20 24 28 32 36 QUANTITY (Thousands of pounds) COSTS (Dollars per pound) 40 The...
7. Short-run supply and long-run equilibrium Consider the competitive market for copper. Assume that, regardless of...
 7. Short-run supply and long-run equilibrium Consider the competitive market for copper. Assume that, regardless of how many firms are in the industry, every firm in the industry is identical and faces the marginal cost (MC), average total cost (ATC), and average variable cost (AVC) curves shown on the following graph. COSTS (Dollars per pound) MC D AVC 0 + 0 + 10 + + + + + + + 20 30 40 50 60 70 80 QUANTITY (Thousands of...
Consider the competitive market for copper. Assume that, regardless of how many firms are in the industry, every firm in the industry is identical and faces the marginal cost (MC), average total cost (ATC)
 7. Short-run supply and long-run equilibrium Consider the competitive market for copper. Assume that, regardless of how many firms are in the industry, every firm in the industry is identical and faces the marginal cost (MC), average total cost (ATC), and average variable cost (AVC) curves shown on the following graph. The following diagram shows the market demand for copper. Use the orange points (square symbol) to plot the initial short-run industry supply curve when there are 20 firms in the market. (Hint:...
6. Short-run supply and long-run equilibrium Consider the competitive market for copper. Assume that, regardless of...
 6. Short-run supply and long-run equilibrium Consider the competitive market for copper. Assume that, regardless of how many firms are in the industry, every firm in the industry is identical and faces the marginal cost (MC), average total cost (ATC), and average variable cost (AVC) curves shown on the following graph. COSTS (Dollars per pound) NON 0 3 27 30 6 12 16 18 21 24 QUANTITY (Thousands of pounds) The following diagram shows the market demand for copper The...
7. Short-run supply and long-run equilibrium Consider the competitive market for copper Assume that, regardless of...
 7. Short-run supply and long-run equilibrium Consider the competitive market for copper Assume that, regardless of how manyfims are in the ndustry, every fim in the industry s dentcal and faces the marginal cost (MC), average total cost (ATC), and average variable cost (AVC) curves shown on the following graph 80 72 64 48 32 244 AVC 3 The following dagram shows the market démand for copper Use the orange points (square symbol) to plot the initial short -run industry...
the market supply curve and exit and entry Aplia Homework 6. The market supply curve and exit and entry Aa Aa Cons...
 the market supply curve and exit and entry
Aplia Homework 6. The market supply curve and exit and entry Aa Aa Consider a perfectly competitive market for copper. Assume that all firms in the industry are identical and have the marginal cost (MC), average total cost (ATC), and average variable cost (AVC) curves shown on the following graph. Assume also that it does not matter how many firms are in the industry. Tool Tip: Place the mouse cursor over orange...
the market supply curve and exit and entry
Aplia Homework 6. The market supply curve and exit and entry Aa Aa Consider a perfectly competitive market for copper. Assume that all firms in the industry are identical and have the marginal cost (MC), average total cost (ATC), and average variable cost (AVC) curves shown on the following graph. Assume also that it does not matter how many firms are in the industry. Tool Tip: Place the mouse cursor over orange...
7. Short-run supply and long-run equilibrium Consider the competitive market for titanium. Assume that, regardless of...
 7. Short-run supply and long-run equilibrium Consider the competitive market for titanium. Assume that, regardless of how many firms are in the industry, every firm in the industry is identi and faces the marginal cost (MC), average total cost (ATC), and average variable cost (AVC) curves shown on the following graph. COSTS (Dollars per pound) AVC мс о OFFFFF 0 3 6 9 12 15 18 21 24 QUANTITY (Thousands of pounds) 27 30 The following diagram shows the market...
Possible Answers 1: Earn zero profit, Earn positive profit, shut down, operate at a loss 2: Enter, Exit, Neither 3:Zero...
 Possible Answers
1: Earn zero profit, Earn positive profit, shut down, operate at
a loss
2: Enter, Exit, Neither
3:Zero, Positive, Negative
4:10,15,20
Consider the perfectly competitive market for copper. Assume that, regardless of how many firms are in the industry, every firm in the industry is identical and faces the marginal cost (MC), average cost (AC), and average variable cost (AVC) curves shown on the following graph. 100 90 80 70 60 50 40 AC 30 20 AVC MC...
Possible Answers
1: Earn zero profit, Earn positive profit, shut down, operate at
a loss
2: Enter, Exit, Neither
3:Zero, Positive, Negative
4:10,15,20
Consider the perfectly competitive market for copper. Assume that, regardless of how many firms are in the industry, every firm in the industry is identical and faces the marginal cost (MC), average cost (AC), and average variable cost (AVC) curves shown on the following graph. 100 90 80 70 60 50 40 AC 30 20 AVC MC...
Consider the competitive market for copper. Assume that, regardless of how many firms are in the industry, every firm in the industry is identical and faces the marginal cost (MC), average total cost (ATC), and average variable cost (AVC) curves shown on
 7. Short-run supply and long-run equilibrium Consider the competitive market for copper. Assume that, regardless of how many firms are in the industry, every firm in the industry is identical and faces the marginal cost (MC), average total cost (ATC), and average variable cost (AVC) curves shown on the following graph.The following diagram shows the market demand for copper.Use the orange points (square symbol) to plot the initial short-run industry supply curve when there are 20 firms in the market. (Hint:...
 5. Short-run supply and long-run equilibrium Consider the competitive market for copper. Assume that, regardless of how many firms are in the industry, every firm in the industry is identical and faces the marginal cost (MC), average total cost (ATC), and average variable cost (AVC) curves shown on the following graph. COSTS (Dollars per pound) AVC MC O 0 3 27 30 6 9 12 15 18 21 24 QUANTITY (Thousands of pounds) The following diagram shows the market demand...
 Consider the competitive market for copper. Assume that, regardless of how many firms are in the industry, every firm in the industry is identical and faces the marginal cost (MC), average total cost (ATC), and average variable cost (AVC) curves shown on the following graph 80 72 64 56 48 ATC 40 32 24 AVC 16 МС П 8 0 0 4 8 12 16 20 24 28 32 36 QUANTITY (Thousands of pounds) COSTS (Dollars per pound) 40 The...
 7. Short-run supply and long-run equilibrium Consider the competitive market for copper. Assume that, regardless of how many firms are in the industry, every firm in the industry is identical and faces the marginal cost (MC), average total cost (ATC), and average variable cost (AVC) curves shown on the following graph. COSTS (Dollars per pound) MC D AVC 0 + 0 + 10 + + + + + + + 20 30 40 50 60 70 80 QUANTITY (Thousands of...
 6. Short-run supply and long-run equilibrium Consider the competitive market for copper. Assume that, regardless of how many firms are in the industry, every firm in the industry is identical and faces the marginal cost (MC), average total cost (ATC), and average variable cost (AVC) curves shown on the following graph. COSTS (Dollars per pound) NON 0 3 27 30 6 12 16 18 21 24 QUANTITY (Thousands of pounds) The following diagram shows the market demand for copper The...
 7. Short-run supply and long-run equilibrium Consider the competitive market for copper Assume that, regardless of how manyfims are in the ndustry, every fim in the industry s dentcal and faces the marginal cost (MC), average total cost (ATC), and average variable cost (AVC) curves shown on the following graph 80 72 64 48 32 244 AVC 3 The following dagram shows the market démand for copper Use the orange points (square symbol) to plot the initial short -run industry...
 the market supply curve and exit and entry
Aplia Homework 6. The market supply curve and exit and entry Aa Aa Consider a perfectly competitive market for copper. Assume that all firms in the industry are identical and have the marginal cost (MC), average total cost (ATC), and average variable cost (AVC) curves shown on the following graph. Assume also that it does not matter how many firms are in the industry. Tool Tip: Place the mouse cursor over orange...
the market supply curve and exit and entry
Aplia Homework 6. The market supply curve and exit and entry Aa Aa Consider a perfectly competitive market for copper. Assume that all firms in the industry are identical and have the marginal cost (MC), average total cost (ATC), and average variable cost (AVC) curves shown on the following graph. Assume also that it does not matter how many firms are in the industry. Tool Tip: Place the mouse cursor over orange...
 7. Short-run supply and long-run equilibrium Consider the competitive market for titanium. Assume that, regardless of how many firms are in the industry, every firm in the industry is identi and faces the marginal cost (MC), average total cost (ATC), and average variable cost (AVC) curves shown on the following graph. COSTS (Dollars per pound) AVC мс о OFFFFF 0 3 6 9 12 15 18 21 24 QUANTITY (Thousands of pounds) 27 30 The following diagram shows the market...
 Possible Answers
1: Earn zero profit, Earn positive profit, shut down, operate at
a loss
2: Enter, Exit, Neither
3:Zero, Positive, Negative
4:10,15,20
Consider the perfectly competitive market for copper. Assume that, regardless of how many firms are in the industry, every firm in the industry is identical and faces the marginal cost (MC), average cost (AC), and average variable cost (AVC) curves shown on the following graph. 100 90 80 70 60 50 40 AC 30 20 AVC MC...
Possible Answers
1: Earn zero profit, Earn positive profit, shut down, operate at
a loss
2: Enter, Exit, Neither
3:Zero, Positive, Negative
4:10,15,20
Consider the perfectly competitive market for copper. Assume that, regardless of how many firms are in the industry, every firm in the industry is identical and faces the marginal cost (MC), average cost (AC), and average variable cost (AVC) curves shown on the following graph. 100 90 80 70 60 50 40 AC 30 20 AVC MC...
Most questions answered within 3 hours.
-
Kylie is a single mom with two dependent children,
Tanner, age 7 and Olivia, age 11....
asked 46 minutes ago -
Phosphorous + bromine = phosphorous tribromide. If 35.0 g of
bromine are reacted and 27.9 grams...
asked 2 hours ago -
Derive the long wavelength limit of the Planck energy density
distribution
asked 2 hours ago -
Calculate the pH of each of the following solutions.
0.50 M HBr
3.1×10⁻⁴ M KOH
4.2×10⁻⁵...
asked 5 hours ago -
For the year ended December 31, Depot Max’s cost of merchandise
sold was $85,600. Inventory at the...
asked 5 hours ago -
Week 10 - Professional Memo Assignment
Professional Memo Assignment
Your mission for this week, should you...
asked 5 hours ago -
Write a Python program that stores the data for each
player on the team, and it...
asked 5 hours ago -
In
the last 3 months, mike never knows when he is going to get his
allowance...
asked 6 hours ago -
Is Ca(OH)2 a Bronsted base, Lewis base, or both? Why?
asked 6 hours ago -
1A- Why don’t voters complain about U.S. tariffs on imported
sugar?
Because sugar is only a...
asked 6 hours ago -
Cash Payback Period
Primera Banco is evaluating two capital investment proposals for
a drive-up ATM kiosk,...
asked 6 hours ago -
Create a button in Swift (Xcode) that will create a charge,
create a charge using Stripe's...
asked 6 hours ago