


Homework Answers
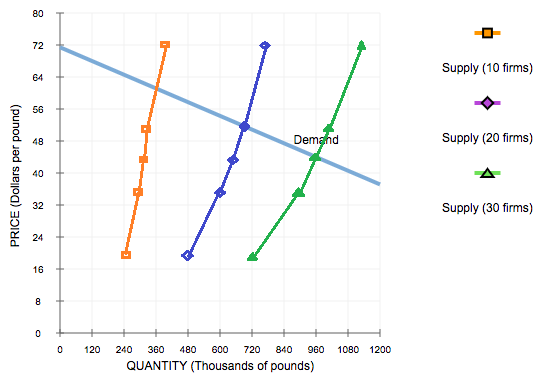
| P | QS-10 | QS-20 | QS-30 | QS-1 FIRM |
| 12 | 0 | 0 | 0 | 0 |
| 20 | 240000 | 480000 | 720000 | 24000 |
| 36 | 300000 | 600000 | 900000 | 30000 |
| 44 | 320000 | 640000 | 960000 | 32000 |
| 52 | 340000 | 680000 | 1020000 | 34000 |
| 72 | 380000 | 760000 | 1140000 | 38000 |
Blanks-
1) 52
2) earn a positive profit
3) enter
4) zero
5) 44
6) 30 firms
The statement is True
Add Answer to:
Consider the competitive market for copper. Assume that, regardless of how many firms are in the...
Consider the competitive market for copper. Assume that,regardless of how many firms are in the...
 7. Short-run supply and long-run equilibrium Consider the competitive market for copper. Assume that, regardless of how many firms are in the industry, every firm in the industry is identical and faces the marginal cost (MC), average total cost (ATC), and average variable cost (AVC) curves shown on the following graph. The following diagram shows the market demand for copper. Use the orange points (square symbol) to plot the initial short-run industry supply curve when there are 20 firms in the market. (Hint:...
Consider the competitive market for copper. Assume that, regardless of how many firms are in the industry, every firm in the industry is identical and faces the marginal cost (MC), average total cost (ATC)
 7. Short-run supply and long-run equilibrium Consider the competitive market for copper. Assume that, regardless of how many firms are in the industry, every firm in the industry is identical and faces the marginal cost (MC), average total cost (ATC), and average variable cost (AVC) curves shown on the following graph. The following diagram shows the market demand for copper. Use the orange points (square symbol) to plot the initial short-run industry supply curve when there are 20 firms in the market. (Hint:...
Consider the competitive market for copper. Assume that, regardless of how many firms are in the industry, every firm in the industry is identical and faces the marginal cost (MC), average total cost (ATC), and average variable cost (AVC) curves shown on
 7. Short-run supply and long-run equilibrium Consider the competitive market for copper. Assume that, regardless of how many firms are in the industry, every firm in the industry is identical and faces the marginal cost (MC), average total cost (ATC), and average variable cost (AVC) curves shown on the following graph.The following diagram shows the market demand for copper.Use the orange points (square symbol) to plot the initial short-run industry supply curve when there are 20 firms in the market. (Hint:...
7. Short-run supply and long-run equilibrium Consider the competitive market for copper. Assume that, regardless of...
 7. Short-run supply and long-run equilibrium Consider the competitive market for copper. Assume that, regardless of how many firms are in the industry, every firm in the industry is identical and faces the marginal cost (MC), average total cost (ATC), and average variable cost (AVC) curves shown on the following graph. COSTS (Dollars per pound) MC D AVC 0 + 0 + 10 + + + + + + + 20 30 40 50 60 70 80 QUANTITY (Thousands of...
5. Short-run supply and long-run equilibrium Consider the competitive market for copper. Assume that, regardless of...
 5. Short-run supply and long-run equilibrium Consider the competitive market for copper. Assume that, regardless of how many firms are in the industry, every firm in the industry is identical and faces the marginal cost (MC), average total cost (ATC), and average variable cost (AVC) curves shown on the following graph. COSTS (Dollars per pound) AVC MC O 0 3 27 30 6 9 12 15 18 21 24 QUANTITY (Thousands of pounds) The following diagram shows the market demand...
Consider the competitive market for copper. Assume that, regardless of how many firms are in the industry, every firm in the Industry is identical and faces the marginal cost (MC), average total cost (ATC), and average variable cost (AVC) curves shown on
 6. Short-run supply and long-run equilibrium Consider the competitive market for copper. Assume that, regardless of how many firms are in the industry, every firm in the Industry is identical and faces the marginal cost (MC), average total cost (ATC), and average variable cost (AVC) curves shown on the following graph. The following diagram shows the market demand for copper. Use the orange points (square symbol) to plot the initial short-run industry supply curve when there are 20 firms in the market. (Hint:...
6. Short-run supply and long-run equilibrium Consider the competitive market for copper. Assume that, regardless of...
 6. Short-run supply and long-run equilibrium Consider the competitive market for copper. Assume that, regardless of how many firms are in the industry, every firm in the industry is identical and faces the marginal cost (MC), average total cost (ATC), and average variable cost (AVC) curves shown on the following graph. COSTS (Dollars per pound) NON 0 3 27 30 6 12 16 18 21 24 QUANTITY (Thousands of pounds) The following diagram shows the market demand for copper The...
5. Short-run supply and long-run equilibrium Consider the competitive market for titanium. Assume that, regardless of...
 5. Short-run supply and long-run equilibrium Consider the competitive market for titanium. Assume that, regardless of how many firms are in the industry, every firm in the industry is identical and faces the marginal cost (MC), average total cost (ATC), and average variable cost (AVC) curves shown on the following graph. 16, 52 COSTS (Dollars per pound) AVC + D + 0 + 3 MC D + + + + + + + 6 9 12 15 18 21 24...
7. Short-run supply and long-run equilibrium Consider the competitive market for titanium. Assume that, regardless of...
 7. Short-run supply and long-run equilibrium Consider the competitive market for titanium. Assume that, regardless of how many firms are in the industry, every firm in the industry is identical and faces the marginal cost (MC), average total cost (ATC), and average variable cost (AVC) curves shown on the following graph. COSTS (Dollars per pound) + MC O AVC 0 5 45 50 10 15 20 25 30 35 40 QUANTITY (Thousands of pounds) The following diagram shows the market...
8. Short-run supply and long-run equilibrium Consider the perfectly competitive market for copper. Assume that, regardless...
 8. Short-run supply and long-run equilibrium Consider the perfectly competitive market for copper. Assume that, regardless of how many firms are in the industry, every firm in the industry is identical and faces the marginal cost (MC), average total cost (ATC), and average variable cost (AVC) curves shown on the following graph. ATC COSTS (Dollars per pound) AVC MC D 0 Ft 0 3 6 9 12 15 18 21 24 27 QUANTITY OF OUTPUT (Thousands of pounds) 30 The...
 7. Short-run supply and long-run equilibrium Consider the competitive market for copper. Assume that, regardless of how many firms are in the industry, every firm in the industry is identical and faces the marginal cost (MC), average total cost (ATC), and average variable cost (AVC) curves shown on the following graph. COSTS (Dollars per pound) MC D AVC 0 + 0 + 10 + + + + + + + 20 30 40 50 60 70 80 QUANTITY (Thousands of...
 5. Short-run supply and long-run equilibrium Consider the competitive market for copper. Assume that, regardless of how many firms are in the industry, every firm in the industry is identical and faces the marginal cost (MC), average total cost (ATC), and average variable cost (AVC) curves shown on the following graph. COSTS (Dollars per pound) AVC MC O 0 3 27 30 6 9 12 15 18 21 24 QUANTITY (Thousands of pounds) The following diagram shows the market demand...
 6. Short-run supply and long-run equilibrium Consider the competitive market for copper. Assume that, regardless of how many firms are in the industry, every firm in the Industry is identical and faces the marginal cost (MC), average total cost (ATC), and average variable cost (AVC) curves shown on the following graph. The following diagram shows the market demand for copper. Use the orange points (square symbol) to plot the initial short-run industry supply curve when there are 20 firms in the market. (Hint:...
 6. Short-run supply and long-run equilibrium Consider the competitive market for copper. Assume that, regardless of how many firms are in the industry, every firm in the industry is identical and faces the marginal cost (MC), average total cost (ATC), and average variable cost (AVC) curves shown on the following graph. COSTS (Dollars per pound) NON 0 3 27 30 6 12 16 18 21 24 QUANTITY (Thousands of pounds) The following diagram shows the market demand for copper The...
 5. Short-run supply and long-run equilibrium Consider the competitive market for titanium. Assume that, regardless of how many firms are in the industry, every firm in the industry is identical and faces the marginal cost (MC), average total cost (ATC), and average variable cost (AVC) curves shown on the following graph. 16, 52 COSTS (Dollars per pound) AVC + D + 0 + 3 MC D + + + + + + + 6 9 12 15 18 21 24...
 7. Short-run supply and long-run equilibrium Consider the competitive market for titanium. Assume that, regardless of how many firms are in the industry, every firm in the industry is identical and faces the marginal cost (MC), average total cost (ATC), and average variable cost (AVC) curves shown on the following graph. COSTS (Dollars per pound) + MC O AVC 0 5 45 50 10 15 20 25 30 35 40 QUANTITY (Thousands of pounds) The following diagram shows the market...
 8. Short-run supply and long-run equilibrium Consider the perfectly competitive market for copper. Assume that, regardless of how many firms are in the industry, every firm in the industry is identical and faces the marginal cost (MC), average total cost (ATC), and average variable cost (AVC) curves shown on the following graph. ATC COSTS (Dollars per pound) AVC MC D 0 Ft 0 3 6 9 12 15 18 21 24 27 QUANTITY OF OUTPUT (Thousands of pounds) 30 The...
Most questions answered within 3 hours.
-
how might the HR Scorecard might be used to demonstrate value
creation that aligns with the...
asked 1 minute from now -
If the racetrack publishes that the odds in favor of a horse
winning a race are...
asked 5 minutes ago -
2.
A particular sample of vinegar has a pH of 2.95.
Part A
If acetic acid...
asked 11 minutes ago -
1a.) A simple random sample of 100 Harvard undergraduates was
given a two-question astronomy test. 13%...
asked 16 minutes ago -
A spider hangs vertically from a thread of negligible mass. In
what situation, the tension in...
asked 17 minutes ago -
is an approach for addressing bottlenecks in a process or
system.
A. Utilization
B. Breakeven Analysis...
asked 38 minutes ago -
A 125 g sample of an unknown substance is heated to 93.6 °C and
then dropped...
asked 29 minutes ago -
How is a car horn like an earthquake? How is it different? Which
of the waves...
asked 33 minutes ago -
Currently, GH Co. sells 42,600 handbags annually at an average
price of $149 each. It is...
asked 58 minutes ago -
A boy of mass 60 kg and a girl of mass 40 kg are together and...
asked 1 hour ago -
Which of the following best describes transferred-in costs?
A) they are the cost of transferring products...
asked 1 hour ago -
Programming in C:
Write a program that accepts an integer and two floating-point
values (All three...
asked 1 hour ago