
Homework Answers
1. Computation of the following ratios.
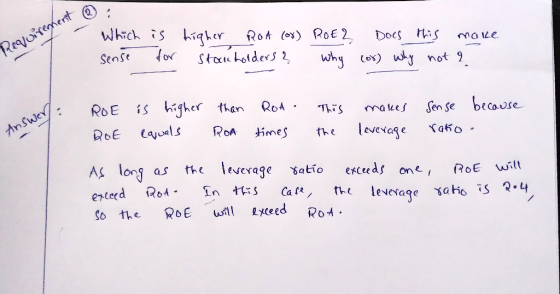
2. Which is higher ROA or ROE ? Does this make sense for stockholders? Why or why not?
Refer to the below images for more detailed solution with explanation.

Add Answer to:
Data from the financial statements of Beautiful Candle Company included the following: Click the icon to...
The comparative income statements and additional data for Harmon Decor, Inc., follow: (Click the icon to...
 The comparative income statements and additional data for Harmon Decor, Inc., follow: (Click the icon to view the comparative income statements.) (Click the icon to view the additional data.) Read the requirement. Select the formula for each of the following component ratios, then calculate the ratios for 2018 and 2017. (Round ALL of your answers to three decimal places, X.XXX, and do not enter in percentage format. Ignore interest expense in your a Ratio Formula 2018 2017 ROS AT ROA...
The comparative Income statements and donal data for Orange Decor, Inc., follow (Click the icon to...
 The comparative Income statements and donal data for Orange Decor, Inc., follow (Click the icon to view the companive income statements) (Click the icon to view the additional data) Read the requirement Select the formula for each of the following componentation. Then the ratios for 2018 and 2017. Round ALL of your answer to the decimal places, XXX, and do not order in percentage format grotere esperise in your analysis) Ratio Formule 2010 2017 ROS (Net income. Preferred dividends) Net...
Given the financial data in the popup window for Disney (DIS) and McDonald's (MCD), compare these...
 Given the financial data in the popup window for Disney (DIS)
and McDonald's (MCD), compare these two companies using the
following financial ratios: debt ratio, current ratio, total
asset turnover, financial leverage, profit margin, and return on
equity. Which company would you invest in, either as a bondholder
or as a stockholder?
The total asset turnover ratio for Disney is:
The total asset turnover ratio for McDonald's is:
The financial leverage ratio for Disney is:
The financial leverage ratio for...
Given the financial data in the popup window for Disney (DIS)
and McDonald's (MCD), compare these two companies using the
following financial ratios: debt ratio, current ratio, total
asset turnover, financial leverage, profit margin, and return on
equity. Which company would you invest in, either as a bondholder
or as a stockholder?
The total asset turnover ratio for Disney is:
The total asset turnover ratio for McDonald's is:
The financial leverage ratio for Disney is:
The financial leverage ratio for...
The company is Comerica CMA and its competitor is Huntington Bancshares HBAN COMERICA (DATA/INFORMATION ABOUT COMPANY) D...
The company is Comerica CMA and its competitor is Huntington Bancshares HBAN COMERICA (DATA/INFORMATION ABOUT COMPANY) DISREGARD THE TTM COLUMN Just the three years Profitability 2016-12 2017-12 2018-12 Tax Rate % 28.81 39.79 19.54 Net Margin % 16.60 23.30 36.87 Asset Turnover (Average) 0.04 0.04 0.05 Return on Assets % 0.65 1.02 1.72 Financial Leverage (Average) 9.36 8.99 9.43 Return on Equity % 6.16 9.37 15.86 Return on Invested Capital % — — — — Interest Coverage — — —...
Return on Investment, DuPont Analysis and Financial Leverage The following table presents selected 2016 financial information...
 Return on Investment, DuPont Analysis and Financial Leverage The following table presents selected 2016 financial information for Sunder Company Sunder Company Selected 2016 Financial Data Balance Sheet: Average total assets $1,000,000 Average total liabilities 500,000 Average stockholders' equity 500,000 Income Statement Sales revenue $1,000,000 Earnings before interest (net of tax) 20,000 Interest expense (net of tax) 15,000 5,000 Net income Round answers to one decimal place (i.e., 0.0025 = 0.3%). Use negative signs with answers, when appropriate. a. Compute Sunder's...
Hometown Supply Company reported the following information in its comparative financial statements for the fiscal year...
 Hometown Supply Company reported the following information in its comparative financial statements for the fiscal year ended January 31, 2018: E: (Click the icon to view the data.) Read the requirements. Requirement 1. Compute net profit margin ratio (%) for the years ended January 31, 2018 and 2017. Did it improve or worsen in 2018? Identify the formula, then calculate profit margin for 2018 and 2017. (Round your answers to the nearest hundredth of a percent, X.XX%.) = Net profit...
Q-2 FINANCIAL RATIO FORMULAS Match each of the following financial ratios with its formula: Accounts Payable...
 Q-2 FINANCIAL RATIO FORMULAS Match each of the following financial ratios with its formula: Accounts Payable Tunover Ratio Fixed Asset Turnover Ratio Asset Turnover Ratio Cash Coverage Ratio Cash Ratio Current Ratio Average Age of Receivables Average Days Supply in Inventory Receivable Turnover Ratio Debt-to-Equity Ratio Earnings per Share (EPS) Financial Leverage Percentage Times Interest Earned Ratio Inventory Turnover Ratico Price/ Earnings (P/E) Ratio Profit Margin Quality of Income Quick Ratio Return on Equity (ROE) Return on Assets (ROA) A....
i Data Table Years Ended December 31, 2019 and 2018 Dollars in thousands 2019 2018 2017...
 i Data Table Years Ended December 31, 2019 and 2018 Dollars in thousands 2019 2018 2017 Net Sales Revenue Cost of Goods Sold Selling and Administrative Expenses Interest Expense $ 184,000 $ 152,000 98,500 83,000 47,000 43,000 8,500 10,000 13,000 9,500 $ 17,000 $ 6,500 Income Tax Expense Net Income Additional data: Total Assets Common Stockholders' Equity Preferred Dividends Common Shares Outstanding During the Year $ 210,000 $ 190,000 $ 174,000 92,500 82,500 77,000 3,000 3,0000 20,000 20,000 10,000 Print...
there are 5 photos Au bolcuole Normal No Spacing Heading 1 Yux Construction Company Financial Stat....
 there are 5 photos
Au bolcuole Normal No Spacing Heading 1 Yux Construction Company Financial Stat. Balance sheet 2018 2017 Formulae Current ratio Current assets/Current 585,632 878,000 $7,282 632,160 Liabilities Aucts Cash Account receivable (A/R) Inventories Total current Asset Gross Fixed Assets Less: Depreciation Net Fixed Assef Total Asset 1.716,480 2,680,112 1,197,160 380,120 817,040 3,497,152 1,287,360 1,926,802 1,202,950 263,160 939,790 2,866,592 Inv. turnover - Sales / Inventories FA turnover - Sales / Net fixed assets TA turnover = Sales /...
there are 5 photos
Au bolcuole Normal No Spacing Heading 1 Yux Construction Company Financial Stat. Balance sheet 2018 2017 Formulae Current ratio Current assets/Current 585,632 878,000 $7,282 632,160 Liabilities Aucts Cash Account receivable (A/R) Inventories Total current Asset Gross Fixed Assets Less: Depreciation Net Fixed Assef Total Asset 1.716,480 2,680,112 1,197,160 380,120 817,040 3,497,152 1,287,360 1,926,802 1,202,950 263,160 939,790 2,866,592 Inv. turnover - Sales / Inventories FA turnover - Sales / Net fixed assets TA turnover = Sales /...
Question 12 pts The following ratios were computed from the financial statement of Darren Technologies: 2018...
Question 12 pts The following ratios were computed from the financial statement of Darren Technologies: 2018 2017 2016 Return on equity 0.30 0.27 0.23 Return on assets 0.17 0.20 0.22 Common equity leverage 0.87 0.90 0.92 Capital structure leverage 2.22 1.60 1.24 Profit margin 0.11 0.10 0.09 Asset turnover 1.69 2.27 2.87 Which of the following statements is true? Group of answer choices There has been a steady decline in ROE from 2016 through 2018. The increase in ROA is...
 The comparative income statements and additional data for Harmon Decor, Inc., follow: (Click the icon to view the comparative income statements.) (Click the icon to view the additional data.) Read the requirement. Select the formula for each of the following component ratios, then calculate the ratios for 2018 and 2017. (Round ALL of your answers to three decimal places, X.XXX, and do not enter in percentage format. Ignore interest expense in your a Ratio Formula 2018 2017 ROS AT ROA...
 The comparative Income statements and donal data for Orange Decor, Inc., follow (Click the icon to view the companive income statements) (Click the icon to view the additional data) Read the requirement Select the formula for each of the following componentation. Then the ratios for 2018 and 2017. Round ALL of your answer to the decimal places, XXX, and do not order in percentage format grotere esperise in your analysis) Ratio Formule 2010 2017 ROS (Net income. Preferred dividends) Net...
 Given the financial data in the popup window for Disney (DIS)
and McDonald's (MCD), compare these two companies using the
following financial ratios: debt ratio, current ratio, total
asset turnover, financial leverage, profit margin, and return on
equity. Which company would you invest in, either as a bondholder
or as a stockholder?
The total asset turnover ratio for Disney is:
The total asset turnover ratio for McDonald's is:
The financial leverage ratio for Disney is:
The financial leverage ratio for...
Given the financial data in the popup window for Disney (DIS)
and McDonald's (MCD), compare these two companies using the
following financial ratios: debt ratio, current ratio, total
asset turnover, financial leverage, profit margin, and return on
equity. Which company would you invest in, either as a bondholder
or as a stockholder?
The total asset turnover ratio for Disney is:
The total asset turnover ratio for McDonald's is:
The financial leverage ratio for Disney is:
The financial leverage ratio for...
 Return on Investment, DuPont Analysis and Financial Leverage The following table presents selected 2016 financial information for Sunder Company Sunder Company Selected 2016 Financial Data Balance Sheet: Average total assets $1,000,000 Average total liabilities 500,000 Average stockholders' equity 500,000 Income Statement Sales revenue $1,000,000 Earnings before interest (net of tax) 20,000 Interest expense (net of tax) 15,000 5,000 Net income Round answers to one decimal place (i.e., 0.0025 = 0.3%). Use negative signs with answers, when appropriate. a. Compute Sunder's...
 Hometown Supply Company reported the following information in its comparative financial statements for the fiscal year ended January 31, 2018: E: (Click the icon to view the data.) Read the requirements. Requirement 1. Compute net profit margin ratio (%) for the years ended January 31, 2018 and 2017. Did it improve or worsen in 2018? Identify the formula, then calculate profit margin for 2018 and 2017. (Round your answers to the nearest hundredth of a percent, X.XX%.) = Net profit...
 Q-2 FINANCIAL RATIO FORMULAS Match each of the following financial ratios with its formula: Accounts Payable Tunover Ratio Fixed Asset Turnover Ratio Asset Turnover Ratio Cash Coverage Ratio Cash Ratio Current Ratio Average Age of Receivables Average Days Supply in Inventory Receivable Turnover Ratio Debt-to-Equity Ratio Earnings per Share (EPS) Financial Leverage Percentage Times Interest Earned Ratio Inventory Turnover Ratico Price/ Earnings (P/E) Ratio Profit Margin Quality of Income Quick Ratio Return on Equity (ROE) Return on Assets (ROA) A....
 i Data Table Years Ended December 31, 2019 and 2018 Dollars in thousands 2019 2018 2017 Net Sales Revenue Cost of Goods Sold Selling and Administrative Expenses Interest Expense $ 184,000 $ 152,000 98,500 83,000 47,000 43,000 8,500 10,000 13,000 9,500 $ 17,000 $ 6,500 Income Tax Expense Net Income Additional data: Total Assets Common Stockholders' Equity Preferred Dividends Common Shares Outstanding During the Year $ 210,000 $ 190,000 $ 174,000 92,500 82,500 77,000 3,000 3,0000 20,000 20,000 10,000 Print...
 there are 5 photos
Au bolcuole Normal No Spacing Heading 1 Yux Construction Company Financial Stat. Balance sheet 2018 2017 Formulae Current ratio Current assets/Current 585,632 878,000 $7,282 632,160 Liabilities Aucts Cash Account receivable (A/R) Inventories Total current Asset Gross Fixed Assets Less: Depreciation Net Fixed Assef Total Asset 1.716,480 2,680,112 1,197,160 380,120 817,040 3,497,152 1,287,360 1,926,802 1,202,950 263,160 939,790 2,866,592 Inv. turnover - Sales / Inventories FA turnover - Sales / Net fixed assets TA turnover = Sales /...
there are 5 photos
Au bolcuole Normal No Spacing Heading 1 Yux Construction Company Financial Stat. Balance sheet 2018 2017 Formulae Current ratio Current assets/Current 585,632 878,000 $7,282 632,160 Liabilities Aucts Cash Account receivable (A/R) Inventories Total current Asset Gross Fixed Assets Less: Depreciation Net Fixed Assef Total Asset 1.716,480 2,680,112 1,197,160 380,120 817,040 3,497,152 1,287,360 1,926,802 1,202,950 263,160 939,790 2,866,592 Inv. turnover - Sales / Inventories FA turnover - Sales / Net fixed assets TA turnover = Sales /...
Most questions answered within 3 hours.
-
The labor force minus the number of employed equals the number
of unemployed.
a. True
b....
asked 1 hour ago -
Determine the mass in units of grams [g] of 0.49 moles [mol]
of a new fictitious...
asked 2 hours ago -
A horizontal mass of M=5kg is on a spring and stretched to
x=0.5m when released from...
asked 3 hours ago -
26 of 50
"I have worked at the Arizona Humane Society for ten years, and
have...
asked 3 hours ago -
Compare and contrast zero based budgeting and incremental (or
base year) budgeting.
asked 3 hours ago -
4 pts 10. Which of the following hypothesis would be MOST
difficult to test experimentally? Group...
asked 3 hours ago -
A business owner makes 1,000 items a day. Each day he or she
contributes eight hours...
asked 3 hours ago -
A
circular loop in the plane of a paper lies inca0.65 T magnetic
field pointing into...
asked 4 hours ago -
A business owner is trying to decide whether to buy, rent, or
lease office space and...
asked 4 hours ago -
Thermal Storage Solar heating of a house is much more efficient
if there is a way...
asked 4 hours ago -
Considering the “fits” for group and job design dimensions,
suppose you had 12 employees with different...
asked 4 hours ago -
Consider TCP connection management.
How many segments are typically involved in the TCP connection
establishment? What...
asked 4 hours ago