#9. Consider exercise 6 of Chapter 2. Suppose we calculated 95%
confidence intervals for the population mean under each treatment.
(I don’t want you to actually calculate them.) Which treatment(s)
would have the widest and narrowest confidence intervals? 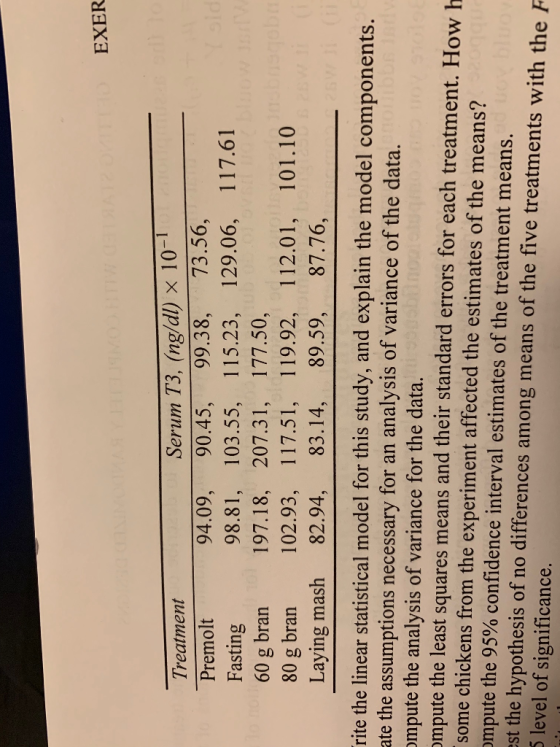
Homework Answers
We use Excel to solve this question-

The treatment 60 g bran have the widest confidence
interval.
The treatment Laying mash have the narrowest confidence
interval.
Add Answer to:
#9. Consider exercise 6 of Chapter 2. Suppose we calculated 95%
confidence intervals for the population...
6. Consider the experiment in Exercise 3. Suppose some of the chickens were lost during the...
6. Consider the experiment in Exercise 3. Suppose some of the chickens were lost during the course of the experiment, resulting in the following set of observations. Treatment Serum T3, (ng/dl) x 10(-1) Premolt 90.09 90.45 99.38 73.56 Fasting 98.81 103.55 115.23 129.06 117.61 60g bran 197.18 207.31 177.5 80 g bran 102.93 117.51 119.92 112.01 101.1 Laying mash 82.94 83.14 89.59 87.76 e. How has the loss of some chickens from the experiment affected the estimates of the means?...
6. Consider the experiment in Exercise 3. Suppose some of the chickens were lost during the...
6. Consider the experiment in Exercise 3. Suppose some of the chickens were lost during the course of the experiment, resulting in the following set of observations. Treatment Serum T3, (ng/dl) x 10(-1) Premolt 90.09 90.45 99.38 73.56 Fasting 98.81 103.55 115.23 129.06 117.61 60g bran 197.18 207.31 177.5 80 g bran 102.93 117.51 119.92 112.01 101.1 Laying mash 82.94 83.14 89.59 87.76 Write the linear statistical model for this study, and explain the model components. State the assumptions necessary...
Use the data on serum T3 concentrations from the experiments with chickens in Exercise 2.3. Treatment...
Use the data on serum T3 concentrations from the experiments with chickens in Exercise 2.3. Treatment Serum T3, (ng/dl) x 10(-1) Premolt 90.09 90.45 99.38 73.56 74.39 Fasting 98.81 103.55 115.23 129.06 117.61 60g bran 197.18 207.31 177.5 226.05 222.74 80 g bran 102.93 117.51 119.92 112.01 101.1 Laying mash 83.14 89.59 87.76 96.43 82.94 Contrasts of interest were the serum T3 concentration differences between successive stages: (1) premolt versus fasting, (2) fasting versus 60 grams of bran, (3) 60...
Most questions answered within 3 hours.
-
MATLAB
Part 1 – randFloatValue.m This function accepts two numbers,
lower and upper, and returns a...
asked 3 minutes ago -
You have been asked to hide prizes around your house for your
3-year old nephew. His...
asked 5 minutes ago -
Ammonia will decompose into nitrogen and hydrogen at high
temperature. An industrial chemist studying this reaction...
asked 11 minutes ago -
10. Complete the table below
only using hexadecimal numbers:
AL CODE
EBX
EAX
[EAX]
mov eax,...
asked 29 minutes ago -
trust is best established through the combination of ------and
------- .
1. magnanimity and justice
2....
asked 44 minutes ago -
Blood pressure is normally taken on the upper arm at the level
of the heart. Suppose,...
asked 43 minutes ago -
Suppose that the satellite around the earth has an orbit that is
24 KM larger in...
asked 46 minutes ago -
Calculate the [OH (aq)] in limes which have a [H3O*(aq)] of 1.3 x
10 mol/L
asked 44 minutes ago -
A nozzle with a radius of 0.250 cm is attached to a garden hose
with a...
asked 56 minutes ago -
PLEASE do not use any loops for the program; only recursion is
allowed
4. Write a...
asked 1 hour ago -
Please help me with me. I did the first part to write the operations but in...
asked 1 hour ago -
Use Cryptool to find the Cryptographic SHA-1 hash value of the
string "abc". The calculator is...
asked 1 hour ago