
Homework Answers
Solution:
Given: Scores on the Math portion of the SAT are believed to be
Normally distributed and range from 200 to 800.
c = confidence level = 90%
Margin of Error = E = 23
We have to find sample size n.

Population standard deviation  is not given, but we can estimate it using Range.


and
Zc is z critical value for c = 90% confidence level.
Find Area = ( 1 + c ) / 2 = ( 1 + 0.90) / 2 = 1.90 / 2 = 0.9500
Look in z table for Area = 0.9500 or its closest area and find corresponding z value.
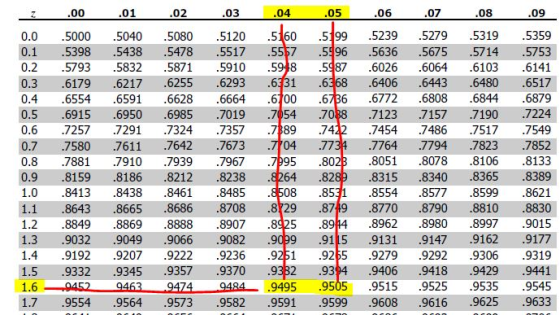
Area 0.9500 is in between 0.9495 and 0.9505 and both the area are at same distance from 0.9500
Thus we look for both area and find both z values
Thus Area 0.9495 corresponds to 1.64 and 0.9505 corresponds to 1.65
Thus average of both z values is : ( 1.64+1.65) / 2 = 1.645
Thus Zc = 1.645
Thus


( Sample size is always rounded up)
Add Answer to:
The SAT is the most widely used test in the undergraduate admissions process. Scores on the...
The SAT is the most widely used test in the undergraduate admissions process. Scores on the...
 The SAT is the most widely used test in the undergraduate admissions process. Scores on the math portion of the SAT are believed to be normally distributed and range from 200 to 800. A researcher from the admissions department at the University of New Hampshire is interested in estimating the mean math SAT scores of the incoming class with 90% confidence. How large a sample should she take to ensure that the margin of error is below 20? (You may...
a. The SAT is the most widely used test in the undergraduate admissions process. Scores on...
a. The SAT is the most widely used test in the undergraduate admissions process. Scores on the math portion of the SAT are believed to be normally distributed and range from 200 to 800. A researcher from the admissions department at the University of New Hampshire is interested in estimating the mean math SAT scores of the incoming class with 95% confidence. How large a sample should she take to ensure that the margin of error is below 32? Round...
The SAT is the most widely used college admission exam. (Most community colleges do not require...
The SAT is the most widely used college admission exam. (Most community colleges do not require students to take this exam.) The mean SAT math score varies by state and by year, so the value of µ depends on the state and the year. But let’s assume that the shape and spread of the distribution of individual SAT math scores in each state is the same each year. More specifically, assume that individual SAT math scores consistently have a normal...
The admissions officer at a small college compares the scores on the Scholastic Aptitude Test (SAT)...
The admissions officer at a small college compares the scores on the Scholastic Aptitude Test (SAT) for the school's male and female applicants. A random sample of 12 male applicants results in a SAT scoring mean of 1053 with a standard deviation of 30. A random sample of 18 female applicants results in a SAT scoring mean of 1155 with a standard deviation of 42. Using this data, find the 90% confidence interval for the true mean difference between the...
The admissions officer at a small college compares the scores on the Scholastic Aptitude Test (SAT)...
The admissions officer at a small college compares the scores on the Scholastic Aptitude Test (SAT) for the school's in-state and out-of-state applicants. A random sample of 8 in-state applicants results in a SAT scoring mean of 1106 with a standard deviation of 57. A random sample of 18 out-of-state applicants results in a SAT scoring mean of 1073 with a standard deviation of 47. Using this data, find the 90% confidence interval for the true mean difference between the...
The college admissions office of york University is reviewing SAT scores . They gather 21 different...
The college admissions office of york University is reviewing SAT scores . They gather 21 different random samples of n = 49 scores. SAT scores are normally distributed in the population with a μ = 1050 and a σ = 210. If the mean is calculated from each sample, how much distance is expected on average between M and μ? Group of answer choices 0 4.29 10 30 45.83
Scores on the math SAT are normally distributed. A sample of 20 SAT scores had standard...
Scores on the math SAT are normally distributed. A sample of 20 SAT scores had standard deviation s = 86. Construct a 98% confidence interval for the population standard deviation σ. Round the answers to two decimal places. The 98% confidence interval is
Scores this year for students taking the SAT Math test for the first time are believed...
 Scores this year for students taking the SAT Math test for the first time are believed to be Normally distributed with mean Mi. For students taking the test for the second time, this year's scores are also believed to be Normally distributed, but with a possibly different mean M2. We wish to estimate the difference M2 - Mi. A random sample of the SAT Math scores of 100 students who took the test for the first time this year was...
The admissions officer at a small college compares the scores on the Scholastic Aptitude Test (SAT)...
The admissions officer at a small college compares the scores on the Scholastic Aptitude Test (SAT) for the school's in-state and out-of-state applicants. A random sample of 19 in-state applicants results in a SAT scoring mean of 1228 with a standard deviation of 39. A random sample of 11 out-of-state applicants results in a SAT scoring mean of 1168 with a standard deviation of 31. Using this data, find the 80% confidence interval for the true mean difference between the...
The admissions officer at a small college compares the scores on the Scholastic Aptitude Test (SAT)...
 The admissions officer at a small college compares the scores on
the Scholastic Aptitude Test (SAT) for the school's male and female
applicants. A random sample of 15 male applicants results in a SAT
scoring mean of 1151 with a standard deviation of 37. A random
sample of 6 female applicants results in a SAT scoring mean of 1095
with a standard deviation of 38. Using this data, find the 95%
confidence interval for the true mean difference between the...
The admissions officer at a small college compares the scores on
the Scholastic Aptitude Test (SAT) for the school's male and female
applicants. A random sample of 15 male applicants results in a SAT
scoring mean of 1151 with a standard deviation of 37. A random
sample of 6 female applicants results in a SAT scoring mean of 1095
with a standard deviation of 38. Using this data, find the 95%
confidence interval for the true mean difference between the...
 The SAT is the most widely used test in the undergraduate admissions process. Scores on the math portion of the SAT are believed to be normally distributed and range from 200 to 800. A researcher from the admissions department at the University of New Hampshire is interested in estimating the mean math SAT scores of the incoming class with 90% confidence. How large a sample should she take to ensure that the margin of error is below 20? (You may...
 Scores this year for students taking the SAT Math test for the first time are believed to be Normally distributed with mean Mi. For students taking the test for the second time, this year's scores are also believed to be Normally distributed, but with a possibly different mean M2. We wish to estimate the difference M2 - Mi. A random sample of the SAT Math scores of 100 students who took the test for the first time this year was...
 The admissions officer at a small college compares the scores on
the Scholastic Aptitude Test (SAT) for the school's male and female
applicants. A random sample of 15 male applicants results in a SAT
scoring mean of 1151 with a standard deviation of 37. A random
sample of 6 female applicants results in a SAT scoring mean of 1095
with a standard deviation of 38. Using this data, find the 95%
confidence interval for the true mean difference between the...
The admissions officer at a small college compares the scores on
the Scholastic Aptitude Test (SAT) for the school's male and female
applicants. A random sample of 15 male applicants results in a SAT
scoring mean of 1151 with a standard deviation of 37. A random
sample of 6 female applicants results in a SAT scoring mean of 1095
with a standard deviation of 38. Using this data, find the 95%
confidence interval for the true mean difference between the...
Most questions answered within 3 hours.
-
Which DNA primer would have the HIGHEST melting temperature?
Question 17 options:
a)
GCATCGGC
b)
AATCGGAT...
asked 5 minutes ago -
what is the charge on the chromium ion in Cr2O3.
a -3
b -2
c 0...
asked 5 minutes ago -
which of the following may lead to speciation?
a. a group of individuals from a mainland...
asked 10 minutes ago -
Please I need today answer for This question and it is very
important and I need...
asked 29 minutes ago -
Five years from today, you plan to invest $3,700 for 7
additional years at 5.8 percent...
asked 29 minutes ago -
GDL just paid a dividend of $4.06 per share. You expect
dividends to grow 12% for...
asked 30 minutes ago -
which of the following is a basic compound?
vinegar
orange juice
seltzer
none of the above
asked 33 minutes ago -
5. Suppose you obtained 0.55 g of crude clove oil from 7.0 g of
fresh cloves....
asked 43 minutes ago -
Provide a paragraph of introduction that generally describes
cognitive development over the lifespan.
asked 48 minutes ago -
In a market, when the price increased the total expenditure on
the good also increased. Is...
asked 48 minutes ago -
If 5.70 g of potassium react with water, how many grams of
hydrogen gas, H2, are...
asked 1 hour ago -
How many moles of CO2 and H2O will be
produced by combustion analysis of 0.010 mol...
asked 1 hour ago