
 could you help me this whole
question?
could you help me this whole
question?
Homework Answers

Add Answer to:
could you help me this whole
question?
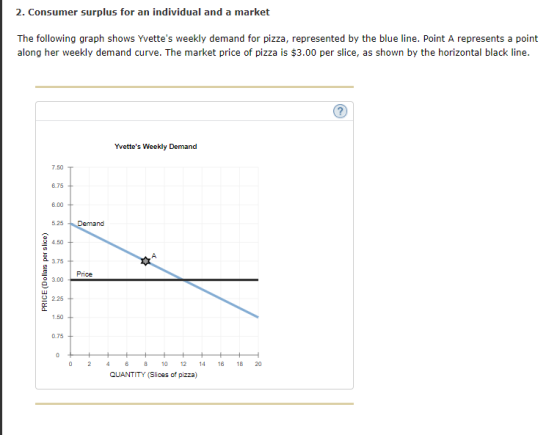
2. Consumer surplus for an individual and a market...
7. Consumer surplus for an individual and a market The following graph shows Becky's weekly demand...
 7. Consumer surplus for an individual and a market The following graph shows Becky's weekly demand for pizza, represented by the blue line. Point A represents point along her weekly demand. The market price of pizza is $3.00 per slice, as shown by the horizontal black line. Becky's Weekly Demand 7.50 6.75 6.00 Demand 5.25 4,50 3.75 Price 3.00 2,25 1.50 0.75 0 0 10 12 14 16 18 20 4 QUANTITY (Slices of pizza) From the previous graph, you...
Consumer surplus for an individual and a market The following graph shows Cho's weekly demand for...
 Consumer surplus for an individual and a
market
The following graph shows Cho's weekly demand for cheesecake,
represented by the blue line. Point A represents a point along her
weekly demand curve. The market price of cheesecake is $3.00 per
slice, as shown by the horizontal black line.
Cho's Weekly Demand 7.50 6.75 6.00 5.25 4.50 3.75 Price 3.00 2.25 1.50 0.75 0 28 10 12 41 18 20 QUANTITY (Slices of cheesecake) From the previous graph, you can tell...
Consumer surplus for an individual and a
market
The following graph shows Cho's weekly demand for cheesecake,
represented by the blue line. Point A represents a point along her
weekly demand curve. The market price of cheesecake is $3.00 per
slice, as shown by the horizontal black line.
Cho's Weekly Demand 7.50 6.75 6.00 5.25 4.50 3.75 Price 3.00 2.25 1.50 0.75 0 28 10 12 41 18 20 QUANTITY (Slices of cheesecake) From the previous graph, you can tell...
could you help me finish this whole question? 4. Producer surplus for an individual and a...
 could you help me finish this
whole question?
4. Producer surplus for an individual and a market Suppose the market for cheesecake is a perfectly competitive market-that is, sellers take the market price as given. Bob owns a restaurant where he sells cheesecake. The following graph shows Bob's weekly supply curve, represented by the orange line. Point A represents a point along his supply curve. The price of cheesecake is $3.00 per slice, as shown by the horizontal black line...
could you help me finish this
whole question?
4. Producer surplus for an individual and a market Suppose the market for cheesecake is a perfectly competitive market-that is, sellers take the market price as given. Bob owns a restaurant where he sells cheesecake. The following graph shows Bob's weekly supply curve, represented by the orange line. Point A represents a point along his supply curve. The price of cheesecake is $3.00 per slice, as shown by the horizontal black line...
Producer surplus for an individual and a market. Suppose the market for pizza is a perfectly...
 Producer surplus for an individual and a
market.
Suppose the market for pizza is a perfectly competitive
market—that is, sellers take the market price as given. Sean owns a
restaurant where he sells pizza. The following graph shows Sean's
weekly supply curve, represented by the orange line. Point A
represents a point along his supply curve. The price of pizza is
$3.00 per slice, as shown by the horizontal black line.
From the previous graph, you can tell that Sean...
Producer surplus for an individual and a
market.
Suppose the market for pizza is a perfectly competitive
market—that is, sellers take the market price as given. Sean owns a
restaurant where he sells pizza. The following graph shows Sean's
weekly supply curve, represented by the orange line. Point A
represents a point along his supply curve. The price of pizza is
$3.00 per slice, as shown by the horizontal black line.
From the previous graph, you can tell that Sean...
2. Consumer surplus for an individual and a market The following graph shows Jacques's weekly demand...
 2. Consumer surplus for an individual and a market The following graph shows Jacques's weekly demand for cheesecake, represented by the blue line. Point A represents a point along his weekly demand curve. The market price of cheesecake is $1.25 per slice, as shown by the horizontal black line. Jacques's Weekly Demand 2.50 Demand 2.25 2.00 1 75 1.50 Price 1 25 1,00 0.75 0.50 0 25 0 2468 101214 16 18 20 QUANTITY (Slices of cheesecake) for his 8th...
Homework (Ch 07) 7. Producer surplus for an individual and a market . Suppose the market...
 Homework (Ch 07) 7. Producer surplus for an individual and a market . Suppose the market for plzza is a perfectly competitive market-that is, sellers take the market price as given. Van owns a restaurant w pizza. The following graph shows Van's weekly supply curve, represented by the orange line. Point A represents of pizza is $3.00 per slice, as shown by the horizontal black line. PRICE (Dollars per slice) R & + From the previous graph, you can tell...
Suppose the market for apple pie is a perfectly competitive market—that is, sellers take the market...
 Suppose the market for apple pie is a perfectly competitive
market—that is, sellers take the market price as given. Yvette owns
a restaurant where she sells apple pie. The following graph shows
Yvette's weekly supply curve, represented by the orange line. Point
A represents a point along her supply curve. The price of apple pie
is $3.00 per slice, as shown by the horizontal black line.
Yvette's Weekly
Supply024681012141618205.004.504.003.503.002.502.001.501.000.500PRICE
(Dollars per slice)QUANTITY (Slices of apple pie)SupplyPriceA
From the previous graph,...
Suppose the market for apple pie is a perfectly competitive
market—that is, sellers take the market price as given. Yvette owns
a restaurant where she sells apple pie. The following graph shows
Yvette's weekly supply curve, represented by the orange line. Point
A represents a point along her supply curve. The price of apple pie
is $3.00 per slice, as shown by the horizontal black line.
Yvette's Weekly
Supply024681012141618205.004.504.003.503.002.502.001.501.000.500PRICE
(Dollars per slice)QUANTITY (Slices of apple pie)SupplyPriceA
From the previous graph,...
Suppose the market for pizza is a perfectly competitive market-that is, sellers take the market price...
 Suppose the market for pizza is a perfectly competitive market-that is, sellers take the market price as given. Rosa owns a restaurant where she sells pizza. The following graph shows Rosa's weekly supply curve, represented by the orange line. Point A represents a point along her supply curve. The price of pizza is $3.00 per slice, as shown by the horizontal black line. From the previous graph, you can tell that Rosa is willing to supply her sth slice of pizza...
The following graph shows Eleanor's weekly demand for apple pie, represented by the blue line. Point...
 The following graph shows Eleanor's weekly demand for apple pie, represented by the blue line. Point A represents a point along her weekly demand curve. The market price of apple pie is $3.00 per slice, as shown by the horizontal black line. From the previews graph, you can tell that Eleanor is willing to pay for her 8th slice of apple pie each week. Because she has to pay only $3.00 per slice, the consumer surplus she gains from the...
Suppose the market for cheesecake is a perfectly competitive market--that is, sellers take the market price...
 Suppose the market for cheesecake is a perfectly competitive market--that is, sellers take the market price as given. Manuel owns a restaurant where he sells cheesecake. The following graph shows Manuel's weekly supply curve, represented by the orange line. Point A represents a point along his supply curve. The price of cheesecake is $3.00 per slice, as shown by the horizontal black line.From the previous graph, you can tell that Manuel is willing to supply his 8th slice of cheesecake...
 7. Consumer surplus for an individual and a market The following graph shows Becky's weekly demand for pizza, represented by the blue line. Point A represents point along her weekly demand. The market price of pizza is $3.00 per slice, as shown by the horizontal black line. Becky's Weekly Demand 7.50 6.75 6.00 Demand 5.25 4,50 3.75 Price 3.00 2,25 1.50 0.75 0 0 10 12 14 16 18 20 4 QUANTITY (Slices of pizza) From the previous graph, you...
 Consumer surplus for an individual and a
market
The following graph shows Cho's weekly demand for cheesecake,
represented by the blue line. Point A represents a point along her
weekly demand curve. The market price of cheesecake is $3.00 per
slice, as shown by the horizontal black line.
Cho's Weekly Demand 7.50 6.75 6.00 5.25 4.50 3.75 Price 3.00 2.25 1.50 0.75 0 28 10 12 41 18 20 QUANTITY (Slices of cheesecake) From the previous graph, you can tell...
Consumer surplus for an individual and a
market
The following graph shows Cho's weekly demand for cheesecake,
represented by the blue line. Point A represents a point along her
weekly demand curve. The market price of cheesecake is $3.00 per
slice, as shown by the horizontal black line.
Cho's Weekly Demand 7.50 6.75 6.00 5.25 4.50 3.75 Price 3.00 2.25 1.50 0.75 0 28 10 12 41 18 20 QUANTITY (Slices of cheesecake) From the previous graph, you can tell...
 could you help me finish this
whole question?
4. Producer surplus for an individual and a market Suppose the market for cheesecake is a perfectly competitive market-that is, sellers take the market price as given. Bob owns a restaurant where he sells cheesecake. The following graph shows Bob's weekly supply curve, represented by the orange line. Point A represents a point along his supply curve. The price of cheesecake is $3.00 per slice, as shown by the horizontal black line...
could you help me finish this
whole question?
4. Producer surplus for an individual and a market Suppose the market for cheesecake is a perfectly competitive market-that is, sellers take the market price as given. Bob owns a restaurant where he sells cheesecake. The following graph shows Bob's weekly supply curve, represented by the orange line. Point A represents a point along his supply curve. The price of cheesecake is $3.00 per slice, as shown by the horizontal black line...
 Producer surplus for an individual and a
market.
Suppose the market for pizza is a perfectly competitive
market—that is, sellers take the market price as given. Sean owns a
restaurant where he sells pizza. The following graph shows Sean's
weekly supply curve, represented by the orange line. Point A
represents a point along his supply curve. The price of pizza is
$3.00 per slice, as shown by the horizontal black line.
From the previous graph, you can tell that Sean...
Producer surplus for an individual and a
market.
Suppose the market for pizza is a perfectly competitive
market—that is, sellers take the market price as given. Sean owns a
restaurant where he sells pizza. The following graph shows Sean's
weekly supply curve, represented by the orange line. Point A
represents a point along his supply curve. The price of pizza is
$3.00 per slice, as shown by the horizontal black line.
From the previous graph, you can tell that Sean...
 2. Consumer surplus for an individual and a market The following graph shows Jacques's weekly demand for cheesecake, represented by the blue line. Point A represents a point along his weekly demand curve. The market price of cheesecake is $1.25 per slice, as shown by the horizontal black line. Jacques's Weekly Demand 2.50 Demand 2.25 2.00 1 75 1.50 Price 1 25 1,00 0.75 0.50 0 25 0 2468 101214 16 18 20 QUANTITY (Slices of cheesecake) for his 8th...
 Homework (Ch 07) 7. Producer surplus for an individual and a market . Suppose the market for plzza is a perfectly competitive market-that is, sellers take the market price as given. Van owns a restaurant w pizza. The following graph shows Van's weekly supply curve, represented by the orange line. Point A represents of pizza is $3.00 per slice, as shown by the horizontal black line. PRICE (Dollars per slice) R & + From the previous graph, you can tell...
 Suppose the market for apple pie is a perfectly competitive
market—that is, sellers take the market price as given. Yvette owns
a restaurant where she sells apple pie. The following graph shows
Yvette's weekly supply curve, represented by the orange line. Point
A represents a point along her supply curve. The price of apple pie
is $3.00 per slice, as shown by the horizontal black line.
Yvette's Weekly
Supply024681012141618205.004.504.003.503.002.502.001.501.000.500PRICE
(Dollars per slice)QUANTITY (Slices of apple pie)SupplyPriceA
From the previous graph,...
Suppose the market for apple pie is a perfectly competitive
market—that is, sellers take the market price as given. Yvette owns
a restaurant where she sells apple pie. The following graph shows
Yvette's weekly supply curve, represented by the orange line. Point
A represents a point along her supply curve. The price of apple pie
is $3.00 per slice, as shown by the horizontal black line.
Yvette's Weekly
Supply024681012141618205.004.504.003.503.002.502.001.501.000.500PRICE
(Dollars per slice)QUANTITY (Slices of apple pie)SupplyPriceA
From the previous graph,...
 Suppose the market for pizza is a perfectly competitive market-that is, sellers take the market price as given. Rosa owns a restaurant where she sells pizza. The following graph shows Rosa's weekly supply curve, represented by the orange line. Point A represents a point along her supply curve. The price of pizza is $3.00 per slice, as shown by the horizontal black line. From the previous graph, you can tell that Rosa is willing to supply her sth slice of pizza...
 The following graph shows Eleanor's weekly demand for apple pie, represented by the blue line. Point A represents a point along her weekly demand curve. The market price of apple pie is $3.00 per slice, as shown by the horizontal black line. From the previews graph, you can tell that Eleanor is willing to pay for her 8th slice of apple pie each week. Because she has to pay only $3.00 per slice, the consumer surplus she gains from the...
 Suppose the market for cheesecake is a perfectly competitive market--that is, sellers take the market price as given. Manuel owns a restaurant where he sells cheesecake. The following graph shows Manuel's weekly supply curve, represented by the orange line. Point A represents a point along his supply curve. The price of cheesecake is $3.00 per slice, as shown by the horizontal black line.From the previous graph, you can tell that Manuel is willing to supply his 8th slice of cheesecake...
Most questions answered within 3 hours.
-
The free energy change for the following reaction at 25 °C, when
[Sn2+] = 1.17 M...
asked 1 hour ago -
An MNE is this kind of industry when competition in one country
is essentially independent of...
asked 2 hours ago -
. For this set of questions, determine what
proportion of a normal distribution is located betweeneach...
asked 3 hours ago -
A college student is employed as a door-to-door newspaper
salesman. Historical data suggests that the student...
asked 4 hours ago -
MATLAB HW 11 problem using Switch Case and Input commands
Write a script file that calculates...
asked 4 hours ago -
Considering gravitational time dilation, calculate the time that
passes in Earth’s surface while 1 hour passes...
asked 4 hours ago -
Minitab Problem: Take the Lake Hume June rainfall data and find
use the processes outlined in...
asked 5 hours ago -
X Company is trying to decide whether to continue using old
equipment to make Product A...
asked 5 hours ago -
IN PYTHON ONLY !! Program 2: Re-work
program #5 (WeeklyHours) from the previous assignment such that...
asked 6 hours ago -
The average length of time between arrivals at a turnpike
toll-booth is 26 seconds. What is...
asked 8 hours ago -
(a) A piston at 6.1 atm contains a gas that occupies a volume of
3.5 L....
asked 9 hours ago -
Please answer true or false. Words
cannot be changed or added in to make it true...
asked 9 hours ago