Producer surplus for an individual and a market.
Suppose the market for pizza is a perfectly competitive market—that is, sellers take the market price as given. Sean owns a restaurant where he sells pizza. The following graph shows Sean's weekly supply curve, represented by the orange line. Point A represents a point along his supply curve. The price of pizza is $3.00 per slice, as shown by the horizontal black line.
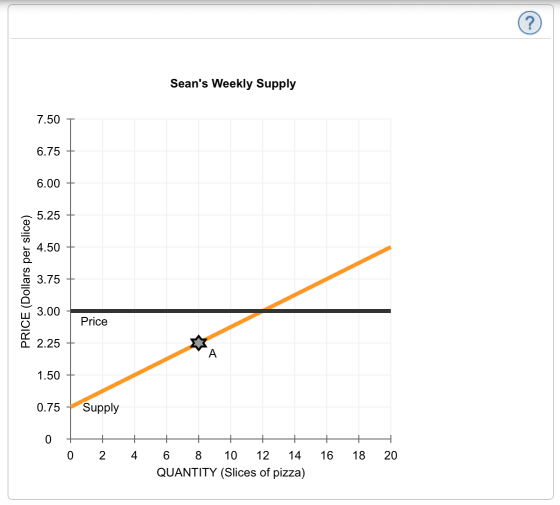
From the previous graph, you can tell that Sean is willing to supply his 8th slice of pizza for ($ ) each week. Since he receives $3.00 per slice, the producer surplus he gains from supplying the 8th slice of pizza is ($ ).
Suppose the price of pizza were to rise to $3.75 per slice. At this higher price, Sean would receive a producer surplus of ($ ) from the 8th slice of pizza he sells.
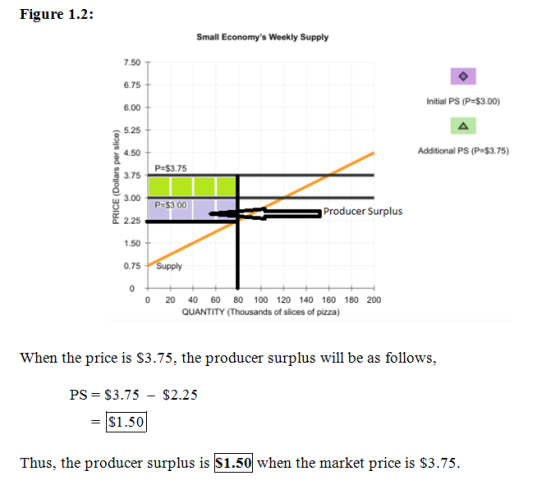
The following graph shows the weekly market supply of pizza in a small economy.
Use the purple point (diamond symbol) to shade the area representing producer surplus (PS) when the price (P) of pizza is $3.00 per slice. Then, use the green point (triangle symbol) to shade the area representing additional producer surplus when the price rises to $3.75 per slice.

Homework Answers

Add Answer to:
Producer surplus for an individual and a
market.
Suppose the market for pizza is a perfectly...
Homework (Ch 07) 7. Producer surplus for an individual and a market . Suppose the market...
 Homework (Ch 07) 7. Producer surplus for an individual and a market . Suppose the market for plzza is a perfectly competitive market-that is, sellers take the market price as given. Van owns a restaurant w pizza. The following graph shows Van's weekly supply curve, represented by the orange line. Point A represents of pizza is $3.00 per slice, as shown by the horizontal black line. PRICE (Dollars per slice) R & + From the previous graph, you can tell...
Suppose the market for pizza is a perfectly competitive market-that is, sellers take the market price...
 Suppose the market for pizza is a perfectly competitive market-that is, sellers take the market price as given. Rosa owns a restaurant where she sells pizza. The following graph shows Rosa's weekly supply curve, represented by the orange line. Point A represents a point along her supply curve. The price of pizza is $3.00 per slice, as shown by the horizontal black line. From the previous graph, you can tell that Rosa is willing to supply her sth slice of pizza...
Suppose the market for cheesecake is a perfectly competitive market--that is, sellers take the market price...
 Suppose the market for cheesecake is a perfectly competitive market--that is, sellers take the market price as given. Manuel owns a restaurant where he sells cheesecake. The following graph shows Manuel's weekly supply curve, represented by the orange line. Point A represents a point along his supply curve. The price of cheesecake is $3.00 per slice, as shown by the horizontal black line.From the previous graph, you can tell that Manuel is willing to supply his 8th slice of cheesecake...
could you help me finish this whole question? 4. Producer surplus for an individual and a...
 could you help me finish this
whole question?
4. Producer surplus for an individual and a market Suppose the market for cheesecake is a perfectly competitive market-that is, sellers take the market price as given. Bob owns a restaurant where he sells cheesecake. The following graph shows Bob's weekly supply curve, represented by the orange line. Point A represents a point along his supply curve. The price of cheesecake is $3.00 per slice, as shown by the horizontal black line...
could you help me finish this
whole question?
4. Producer surplus for an individual and a market Suppose the market for cheesecake is a perfectly competitive market-that is, sellers take the market price as given. Bob owns a restaurant where he sells cheesecake. The following graph shows Bob's weekly supply curve, represented by the orange line. Point A represents a point along his supply curve. The price of cheesecake is $3.00 per slice, as shown by the horizontal black line...
7. Producer surplus for an individual and a market Suppose the market for cheesecake is a...
 7. Producer surplus for an individual and a market Suppose the market for cheesecake is a perfectly competitive market-that is, sellers take the market price as given. Manuel owns a restaurant where he sells cheesecake. The following graph shows Manuel's weekly supply curve, represented by the orange line. Point A represents a point along his supply curve. The price of cheesecake is $3.00 per slice, as shown by the horizontal black line. Manuel's Weekly Supply 5.00 4.00 3.50 3.50 3.00...
7. Producer surplus for an individual and a market Suppose the market for cheesecake s a...
 7. Producer surplus for an individual and a market Suppose the market for cheesecake s a parfectly competitive market-that s,sellars talke the market price as given. Shen owns a restaurant where he sells cheesecake. The follawing graph shows Shan's weddy supply curve, represented by the arange line. Point A represerts a point alang his supply curve. The price of cheesacake is $3.00 per slicn, as shown by the horizontal black lne. 3hen's weakly 3uppty the previcus graph, you can tell...
Suppose the market for apple pie is a perfectly competitive market-that is, sellers take the market...
 Suppose the market for apple pie is a perfectly competitive market-that is, sellers take the market price as given. Dmitri owns a restaurant where he curve. The price of apple pie is $3.00 per slice, as shown by the horizontal black line. Dmitri's Weekly Supply 6.73 PRICE (Dollars per slice) Supply 0 2 4 16 18 20 6 8 10 12 14 QUANTITY (Slices of apple pie) From the previous graph, you can tell that Dmitri is willing to supply...
could you help me this whole question? 2. Consumer surplus for an individual and a market...
 could you help me this whole
question?
2. Consumer surplus for an individual and a market The following graph shows Yvette's weekly demand for pizza, represented by the blue line. Point A represents a point along her weekly demand curve. The market price of pizza is $3.00 per slice, as shown by the horizontal black line. Yvette's Weekly Demand 7.50 T 6.75 .25Demand tx 3.75 Price e 3.00 2 으2.25 0.75 0 246 8 14 16 18 20 QUANTITY (Slices...
could you help me this whole
question?
2. Consumer surplus for an individual and a market The following graph shows Yvette's weekly demand for pizza, represented by the blue line. Point A represents a point along her weekly demand curve. The market price of pizza is $3.00 per slice, as shown by the horizontal black line. Yvette's Weekly Demand 7.50 T 6.75 .25Demand tx 3.75 Price e 3.00 2 으2.25 0.75 0 246 8 14 16 18 20 QUANTITY (Slices...
7. Consumer surplus for an individual and a market The following graph shows Becky's weekly demand...
 7. Consumer surplus for an individual and a market The following graph shows Becky's weekly demand for pizza, represented by the blue line. Point A represents point along her weekly demand. The market price of pizza is $3.00 per slice, as shown by the horizontal black line. Becky's Weekly Demand 7.50 6.75 6.00 Demand 5.25 4,50 3.75 Price 3.00 2,25 1.50 0.75 0 0 10 12 14 16 18 20 4 QUANTITY (Slices of pizza) From the previous graph, you...
Suppose the market for apple pie is a perfectly competitive market—that is, sellers take the market...
 Suppose the market for apple pie is a perfectly competitive
market—that is, sellers take the market price as given. Yvette owns
a restaurant where she sells apple pie. The following graph shows
Yvette's weekly supply curve, represented by the orange line. Point
A represents a point along her supply curve. The price of apple pie
is $3.00 per slice, as shown by the horizontal black line.
Yvette's Weekly
Supply024681012141618205.004.504.003.503.002.502.001.501.000.500PRICE
(Dollars per slice)QUANTITY (Slices of apple pie)SupplyPriceA
From the previous graph,...
Suppose the market for apple pie is a perfectly competitive
market—that is, sellers take the market price as given. Yvette owns
a restaurant where she sells apple pie. The following graph shows
Yvette's weekly supply curve, represented by the orange line. Point
A represents a point along her supply curve. The price of apple pie
is $3.00 per slice, as shown by the horizontal black line.
Yvette's Weekly
Supply024681012141618205.004.504.003.503.002.502.001.501.000.500PRICE
(Dollars per slice)QUANTITY (Slices of apple pie)SupplyPriceA
From the previous graph,...
 Homework (Ch 07) 7. Producer surplus for an individual and a market . Suppose the market for plzza is a perfectly competitive market-that is, sellers take the market price as given. Van owns a restaurant w pizza. The following graph shows Van's weekly supply curve, represented by the orange line. Point A represents of pizza is $3.00 per slice, as shown by the horizontal black line. PRICE (Dollars per slice) R & + From the previous graph, you can tell...
 Suppose the market for pizza is a perfectly competitive market-that is, sellers take the market price as given. Rosa owns a restaurant where she sells pizza. The following graph shows Rosa's weekly supply curve, represented by the orange line. Point A represents a point along her supply curve. The price of pizza is $3.00 per slice, as shown by the horizontal black line. From the previous graph, you can tell that Rosa is willing to supply her sth slice of pizza...
 Suppose the market for cheesecake is a perfectly competitive market--that is, sellers take the market price as given. Manuel owns a restaurant where he sells cheesecake. The following graph shows Manuel's weekly supply curve, represented by the orange line. Point A represents a point along his supply curve. The price of cheesecake is $3.00 per slice, as shown by the horizontal black line.From the previous graph, you can tell that Manuel is willing to supply his 8th slice of cheesecake...
 could you help me finish this
whole question?
4. Producer surplus for an individual and a market Suppose the market for cheesecake is a perfectly competitive market-that is, sellers take the market price as given. Bob owns a restaurant where he sells cheesecake. The following graph shows Bob's weekly supply curve, represented by the orange line. Point A represents a point along his supply curve. The price of cheesecake is $3.00 per slice, as shown by the horizontal black line...
could you help me finish this
whole question?
4. Producer surplus for an individual and a market Suppose the market for cheesecake is a perfectly competitive market-that is, sellers take the market price as given. Bob owns a restaurant where he sells cheesecake. The following graph shows Bob's weekly supply curve, represented by the orange line. Point A represents a point along his supply curve. The price of cheesecake is $3.00 per slice, as shown by the horizontal black line...
 7. Producer surplus for an individual and a market Suppose the market for cheesecake is a perfectly competitive market-that is, sellers take the market price as given. Manuel owns a restaurant where he sells cheesecake. The following graph shows Manuel's weekly supply curve, represented by the orange line. Point A represents a point along his supply curve. The price of cheesecake is $3.00 per slice, as shown by the horizontal black line. Manuel's Weekly Supply 5.00 4.00 3.50 3.50 3.00...
 7. Producer surplus for an individual and a market Suppose the market for cheesecake s a parfectly competitive market-that s,sellars talke the market price as given. Shen owns a restaurant where he sells cheesecake. The follawing graph shows Shan's weddy supply curve, represented by the arange line. Point A represerts a point alang his supply curve. The price of cheesacake is $3.00 per slicn, as shown by the horizontal black lne. 3hen's weakly 3uppty the previcus graph, you can tell...
 Suppose the market for apple pie is a perfectly competitive market-that is, sellers take the market price as given. Dmitri owns a restaurant where he curve. The price of apple pie is $3.00 per slice, as shown by the horizontal black line. Dmitri's Weekly Supply 6.73 PRICE (Dollars per slice) Supply 0 2 4 16 18 20 6 8 10 12 14 QUANTITY (Slices of apple pie) From the previous graph, you can tell that Dmitri is willing to supply...
 could you help me this whole
question?
2. Consumer surplus for an individual and a market The following graph shows Yvette's weekly demand for pizza, represented by the blue line. Point A represents a point along her weekly demand curve. The market price of pizza is $3.00 per slice, as shown by the horizontal black line. Yvette's Weekly Demand 7.50 T 6.75 .25Demand tx 3.75 Price e 3.00 2 으2.25 0.75 0 246 8 14 16 18 20 QUANTITY (Slices...
could you help me this whole
question?
2. Consumer surplus for an individual and a market The following graph shows Yvette's weekly demand for pizza, represented by the blue line. Point A represents a point along her weekly demand curve. The market price of pizza is $3.00 per slice, as shown by the horizontal black line. Yvette's Weekly Demand 7.50 T 6.75 .25Demand tx 3.75 Price e 3.00 2 으2.25 0.75 0 246 8 14 16 18 20 QUANTITY (Slices...
 7. Consumer surplus for an individual and a market The following graph shows Becky's weekly demand for pizza, represented by the blue line. Point A represents point along her weekly demand. The market price of pizza is $3.00 per slice, as shown by the horizontal black line. Becky's Weekly Demand 7.50 6.75 6.00 Demand 5.25 4,50 3.75 Price 3.00 2,25 1.50 0.75 0 0 10 12 14 16 18 20 4 QUANTITY (Slices of pizza) From the previous graph, you...
 Suppose the market for apple pie is a perfectly competitive
market—that is, sellers take the market price as given. Yvette owns
a restaurant where she sells apple pie. The following graph shows
Yvette's weekly supply curve, represented by the orange line. Point
A represents a point along her supply curve. The price of apple pie
is $3.00 per slice, as shown by the horizontal black line.
Yvette's Weekly
Supply024681012141618205.004.504.003.503.002.502.001.501.000.500PRICE
(Dollars per slice)QUANTITY (Slices of apple pie)SupplyPriceA
From the previous graph,...
Suppose the market for apple pie is a perfectly competitive
market—that is, sellers take the market price as given. Yvette owns
a restaurant where she sells apple pie. The following graph shows
Yvette's weekly supply curve, represented by the orange line. Point
A represents a point along her supply curve. The price of apple pie
is $3.00 per slice, as shown by the horizontal black line.
Yvette's Weekly
Supply024681012141618205.004.504.003.503.002.502.001.501.000.500PRICE
(Dollars per slice)QUANTITY (Slices of apple pie)SupplyPriceA
From the previous graph,...
Most questions answered within 3 hours.
-
How
would I know whether a given amino acid has an ionizable group or
not? please...
asked 3 minutes ago -
True or false?
True False The function of the enzyme acyl CoA
synthetase is the ATP-dependent coupling...
asked 4 minutes ago -
Nadia Corporation adjusts its debt so that its interest coverage
(EBIT/Interest) remains constant at 3. Nadia’s...
asked 5 minutes ago -
In a clinical trial, 20 out of 600 patients taking a
prescription drug complained of flulike...
asked 11 minutes ago -
7. How many types of nuclear processes can produce energy? 8.
How many types of radioactive...
asked 15 minutes ago -
For both the Sn2 and Sn1 reaction
conditions:
Structure | Rxn (Y/N) at room T° Rxn...
asked 16 minutes ago -
11. In cell N2, enter a formula using the IF function and a
structured reference to...
asked 15 minutes ago -
There is X-linked mutations in flies in this example. You need
to determine the inheritence pattern...
asked 18 minutes ago -
1) There is a 5.0 μC charge at each of 3 corners of a square
(each...
asked 29 minutes ago -
A study of 420,095 cell phone users found that
134 of them developed cancer of the...
asked 32 minutes ago -
2.50 g of NH4Cl is added to 12.9 g of water. Calculate the
molality of the...
asked 35 minutes ago -
Part 1
(a) Calculate the pH at 25°C of a 0.10 M solution of a
weak...
asked 37 minutes ago