 Part (d). What exactly is the question asking to find, and how do
I solve the problem? Please explain with detail as to how I can
approach the problem
Part (d). What exactly is the question asking to find, and how do
I solve the problem? Please explain with detail as to how I can
approach the problemHomework Answers
d)
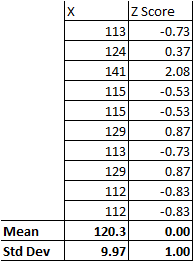
For any sample if we calculate corresponding Z-Score for each data-point and then calculate the mean and Std Deviation of all the z-scores, then always, mean will be zero and std deviation will be 1.
Eg:
Add Answer to:
Part (d). What exactly is the question asking to find, and how do
I solve the...
Question 7 Paint viscosity is a measure of the thickness that determines whether the paint will...
 Question 7 Paint viscosity is a measure of the thickness that determines whether the paint will cover in a single coat. A random sample of latex paint viscocities (in Krebs units) was obtained, and the data are given in the following table: 113,124,141,115,115,129,113,129,112,112 a. Find z-score for each observation. b. Find the mean and standard deviation for all of the z-scores c For any set of observations, can you calculate the mean and standard deviation of the corresponding z-scores? Prove...
How do I plot a series graph with this data provided? Month 1987 1988 1989 1990...
How do I plot a series graph with this data provided? Month 1987 1988 1989 1990 1991 1992 1993 1994 1995 1996 Jan 95 104 101 88 132 125 111 127 119 147 Feb 94 100 96 110 109 118 123 129 147 146 Mar 98 99 82 129 101 121 121 132 164 133 Apr 96 88 84 113 111 140 139 108 135 148 May 95 89 85 114 140 141 119 115 124 141 Jun 115 108...
It is not immediately clear if this I However the coefficient of variation is given by...
 It is not immediately clear if this I However the coefficient of variation is given by s 6.0 10006 = 0006 and fro m this we judge that the variation in the data is relatively small. he weight of an object was measured thirty times and the following observations were obtained 2 6-120 6-129 6116 6114 6-112 6-119 6-119 6-121 6-124 6.127 6-113 6116 6.117 6-126 6 123 6-123 6-122 6118 6 120 6120 6-121 6-124 6-114 6-121 6120 6-116...
how do I solve this? For a sample of 273 female heights, the mean was 64.9...
 how do I solve this?
For a sample of 273 female heights, the mean was 64.9 inches and the standard deviation was 2.6 inches. The shortest person in this sample had a height of 58 inches. a. Find the z-score for the height of 58 inches. b. What does the negative sign for the z-score represent? c. Is this observation a potential outlier according to the three standard deviation distance criterion?Explain. a. Find the z-score z(Round to one decimal place...
how do I solve this?
For a sample of 273 female heights, the mean was 64.9 inches and the standard deviation was 2.6 inches. The shortest person in this sample had a height of 58 inches. a. Find the z-score for the height of 58 inches. b. What does the negative sign for the z-score represent? c. Is this observation a potential outlier according to the three standard deviation distance criterion?Explain. a. Find the z-score z(Round to one decimal place...
I don’t understand what c and d are asking, please answer these. Expert Q8A Done 5....
 I don’t understand what c and d are asking, please answer
these.
Expert Q8A Done 5. Suppose that a researcher approximates the density of the CAD/USD exchange rate in January 2018 by z~N(0.75, 0.024) (so the mean is 0.75 and the standard deviation is 0.024, measured in US dollars). (a) Find the probability of observing an exchange rate less than 0.762. (b) Find the probability of observing an exchange rate between 0.75 and 0.78. (c) Find a value m such...
I don’t understand what c and d are asking, please answer
these.
Expert Q8A Done 5. Suppose that a researcher approximates the density of the CAD/USD exchange rate in January 2018 by z~N(0.75, 0.024) (so the mean is 0.75 and the standard deviation is 0.024, measured in US dollars). (a) Find the probability of observing an exchange rate less than 0.762. (b) Find the probability of observing an exchange rate between 0.75 and 0.78. (c) Find a value m such...
QUESTION 1: Create a boxplot for the weights of the women. QUESTION 2: Find the mean...
 QUESTION 1: Create a boxplot for the weights of
the women.
QUESTION 2: Find the mean weight for men.
Round to 3 decimal places.
QUESTION 3: Find the median weight for men.
QUESTION 4:Find the mode for the men's
weights.
QUESTION 5: Find the midrange for the women's
weights.
QUESTION 6: Find the standard deviation for the
women's weights. Round to 3 decimal places.
QUESTION 7: Find the standard deviation for the
men's weights. Round to 3 decimal places.
QUESTION...
QUESTION 1: Create a boxplot for the weights of
the women.
QUESTION 2: Find the mean weight for men.
Round to 3 decimal places.
QUESTION 3: Find the median weight for men.
QUESTION 4:Find the mode for the men's
weights.
QUESTION 5: Find the midrange for the women's
weights.
QUESTION 6: Find the standard deviation for the
women's weights. Round to 3 decimal places.
QUESTION 7: Find the standard deviation for the
men's weights. Round to 3 decimal places.
QUESTION...
Find the Z-score corresponding to the minimum and maximum in the data set. I have already calculated the mean and standard deviation, but please help with questions 3, 4, and 5. This is a sample data set.
Consider the given data set.n = 12 measurements: 9, 8, 1, 3, 5, 5, 5, 4, 8, 5, 4, 0Find the mean. 4.75Find the standard deviation. (Round your answer to four decimal places.) 2.701Find the z-score corresponding to the minimum in the data set. (Round your answer to two decimal places.)z = Find the z-score corresponding to the maximum in the data set. (Round your answer to two decimal places.) z = Multiple Choice 5. Do the z-scores indicate...
QUESTION 4 Solve the problem. Using the employment information in the table on Alpha Corporation, find...
 QUESTION 4 Solve the problem. Using the employment information in the table on Alpha Corporation, find the class midpoint for class 1-5 Years employed at Alpha Corporation 1 points Class Limits (years of service) (No of emp Frequency 6-10 11-15 16-20 21-25 26-30 10 03,0 03.5 O 5.0 1 points Save QUESTIONS Solve the problem. Express all z scores with two decimal places. Scores on a test have a mean of 70 and a standard deviation of 12.Michelle has a...
1. how do I solve this problem? please explain how to solve it using the calculator....
 1.
how do I solve this problem? please explain how to solve it
using the calculator. thanks!
2.
how do I solve part b? thanks!
21) Find the value of 20.10 Provide a sketch of the solution. area =0.10 Zo.10 Z 23) 3) A binomial A binomial probability with parameters, n = 9 and ps a) Find the probabilities and construct a binomial prob binompdf (9,0.8x) binomial probability distribution: X PEX) 05.12E- 1 1.943E-5 2 2.99EU 10.003 loan 5 10,066...
1.
how do I solve this problem? please explain how to solve it
using the calculator. thanks!
2.
how do I solve part b? thanks!
21) Find the value of 20.10 Provide a sketch of the solution. area =0.10 Zo.10 Z 23) 3) A binomial A binomial probability with parameters, n = 9 and ps a) Find the probabilities and construct a binomial prob binompdf (9,0.8x) binomial probability distribution: X PEX) 05.12E- 1 1.943E-5 2 2.99EU 10.003 loan 5 10,066...
Need help on this Matlab problem, I do not know how to do it Problem 2....
 Need help on this Matlab problem, I do not know how to do it
Problem 2. (2D Sorting) The following table contains the scores for the 4 students A,B.C and D for four Homeworks HW1 50 20 85 65 HW2HW 45 80 30 95 HW4 75 35 15 80 Student A Student B Student C Student D 40 60 100 a) Create a matrix with the above data b) What is the minimum score of all four homework? (use the...
Need help on this Matlab problem, I do not know how to do it
Problem 2. (2D Sorting) The following table contains the scores for the 4 students A,B.C and D for four Homeworks HW1 50 20 85 65 HW2HW 45 80 30 95 HW4 75 35 15 80 Student A Student B Student C Student D 40 60 100 a) Create a matrix with the above data b) What is the minimum score of all four homework? (use the...
 Question 7 Paint viscosity is a measure of the thickness that determines whether the paint will cover in a single coat. A random sample of latex paint viscocities (in Krebs units) was obtained, and the data are given in the following table: 113,124,141,115,115,129,113,129,112,112 a. Find z-score for each observation. b. Find the mean and standard deviation for all of the z-scores c For any set of observations, can you calculate the mean and standard deviation of the corresponding z-scores? Prove...
 It is not immediately clear if this I However the coefficient of variation is given by s 6.0 10006 = 0006 and fro m this we judge that the variation in the data is relatively small. he weight of an object was measured thirty times and the following observations were obtained 2 6-120 6-129 6116 6114 6-112 6-119 6-119 6-121 6-124 6.127 6-113 6116 6.117 6-126 6 123 6-123 6-122 6118 6 120 6120 6-121 6-124 6-114 6-121 6120 6-116...
 how do I solve this?
For a sample of 273 female heights, the mean was 64.9 inches and the standard deviation was 2.6 inches. The shortest person in this sample had a height of 58 inches. a. Find the z-score for the height of 58 inches. b. What does the negative sign for the z-score represent? c. Is this observation a potential outlier according to the three standard deviation distance criterion?Explain. a. Find the z-score z(Round to one decimal place...
how do I solve this?
For a sample of 273 female heights, the mean was 64.9 inches and the standard deviation was 2.6 inches. The shortest person in this sample had a height of 58 inches. a. Find the z-score for the height of 58 inches. b. What does the negative sign for the z-score represent? c. Is this observation a potential outlier according to the three standard deviation distance criterion?Explain. a. Find the z-score z(Round to one decimal place...
 I don’t understand what c and d are asking, please answer
these.
Expert Q8A Done 5. Suppose that a researcher approximates the density of the CAD/USD exchange rate in January 2018 by z~N(0.75, 0.024) (so the mean is 0.75 and the standard deviation is 0.024, measured in US dollars). (a) Find the probability of observing an exchange rate less than 0.762. (b) Find the probability of observing an exchange rate between 0.75 and 0.78. (c) Find a value m such...
I don’t understand what c and d are asking, please answer
these.
Expert Q8A Done 5. Suppose that a researcher approximates the density of the CAD/USD exchange rate in January 2018 by z~N(0.75, 0.024) (so the mean is 0.75 and the standard deviation is 0.024, measured in US dollars). (a) Find the probability of observing an exchange rate less than 0.762. (b) Find the probability of observing an exchange rate between 0.75 and 0.78. (c) Find a value m such...
 QUESTION 1: Create a boxplot for the weights of
the women.
QUESTION 2: Find the mean weight for men.
Round to 3 decimal places.
QUESTION 3: Find the median weight for men.
QUESTION 4:Find the mode for the men's
weights.
QUESTION 5: Find the midrange for the women's
weights.
QUESTION 6: Find the standard deviation for the
women's weights. Round to 3 decimal places.
QUESTION 7: Find the standard deviation for the
men's weights. Round to 3 decimal places.
QUESTION...
QUESTION 1: Create a boxplot for the weights of
the women.
QUESTION 2: Find the mean weight for men.
Round to 3 decimal places.
QUESTION 3: Find the median weight for men.
QUESTION 4:Find the mode for the men's
weights.
QUESTION 5: Find the midrange for the women's
weights.
QUESTION 6: Find the standard deviation for the
women's weights. Round to 3 decimal places.
QUESTION 7: Find the standard deviation for the
men's weights. Round to 3 decimal places.
QUESTION...
 QUESTION 4 Solve the problem. Using the employment information in the table on Alpha Corporation, find the class midpoint for class 1-5 Years employed at Alpha Corporation 1 points Class Limits (years of service) (No of emp Frequency 6-10 11-15 16-20 21-25 26-30 10 03,0 03.5 O 5.0 1 points Save QUESTIONS Solve the problem. Express all z scores with two decimal places. Scores on a test have a mean of 70 and a standard deviation of 12.Michelle has a...
 1.
how do I solve this problem? please explain how to solve it
using the calculator. thanks!
2.
how do I solve part b? thanks!
21) Find the value of 20.10 Provide a sketch of the solution. area =0.10 Zo.10 Z 23) 3) A binomial A binomial probability with parameters, n = 9 and ps a) Find the probabilities and construct a binomial prob binompdf (9,0.8x) binomial probability distribution: X PEX) 05.12E- 1 1.943E-5 2 2.99EU 10.003 loan 5 10,066...
1.
how do I solve this problem? please explain how to solve it
using the calculator. thanks!
2.
how do I solve part b? thanks!
21) Find the value of 20.10 Provide a sketch of the solution. area =0.10 Zo.10 Z 23) 3) A binomial A binomial probability with parameters, n = 9 and ps a) Find the probabilities and construct a binomial prob binompdf (9,0.8x) binomial probability distribution: X PEX) 05.12E- 1 1.943E-5 2 2.99EU 10.003 loan 5 10,066...
 Need help on this Matlab problem, I do not know how to do it
Problem 2. (2D Sorting) The following table contains the scores for the 4 students A,B.C and D for four Homeworks HW1 50 20 85 65 HW2HW 45 80 30 95 HW4 75 35 15 80 Student A Student B Student C Student D 40 60 100 a) Create a matrix with the above data b) What is the minimum score of all four homework? (use the...
Need help on this Matlab problem, I do not know how to do it
Problem 2. (2D Sorting) The following table contains the scores for the 4 students A,B.C and D for four Homeworks HW1 50 20 85 65 HW2HW 45 80 30 95 HW4 75 35 15 80 Student A Student B Student C Student D 40 60 100 a) Create a matrix with the above data b) What is the minimum score of all four homework? (use the...
Most questions answered within 3 hours.
-
In Chapter 1 you created a program named Triangle in
which you displayed a seven-line triangle...
asked 1 minute ago -
python
Define a function called print_values which takes a dictionary
object as a parameter. The function...
asked 5 minutes ago -
Research question: What are the differences between separately
stated and non separately stated transactions in an...
asked 23 minutes ago -
By using Arduino write a code that connects two LEDs to two
push-buttons. Each button controls...
asked 1 hour ago -
Bank of America has bonds that pay a coupon interest rate of 5.5
percent and mature...
asked 2 hours ago -
Problem: Patient Fees C++
You are to write a program that computes a patient’s bill for...
asked 3 hours ago -
In a population of interest, we know that, 77% drink coffee, and
23% drink tea. Assume...
asked 4 hours ago -
Given that f(x) = e-(x-1) for x > 1, determine the following
probabilities:
a) P(X <...
asked 3 hours ago -
A mechanic pushes a 2.60 ✕ 103-kg car from rest to a speed of v,
doing...
asked 3 hours ago -
International information systems result in all of the following
except:
A. improved quality of information flow....
asked 3 hours ago -
The president of the retailer Prime Products has just approached
the company’s bank with a request...
asked 4 hours ago -
If the carrying amount is $200,000 and recoverable amount is
$205000, the impairment amount is:
Select...
asked 4 hours ago